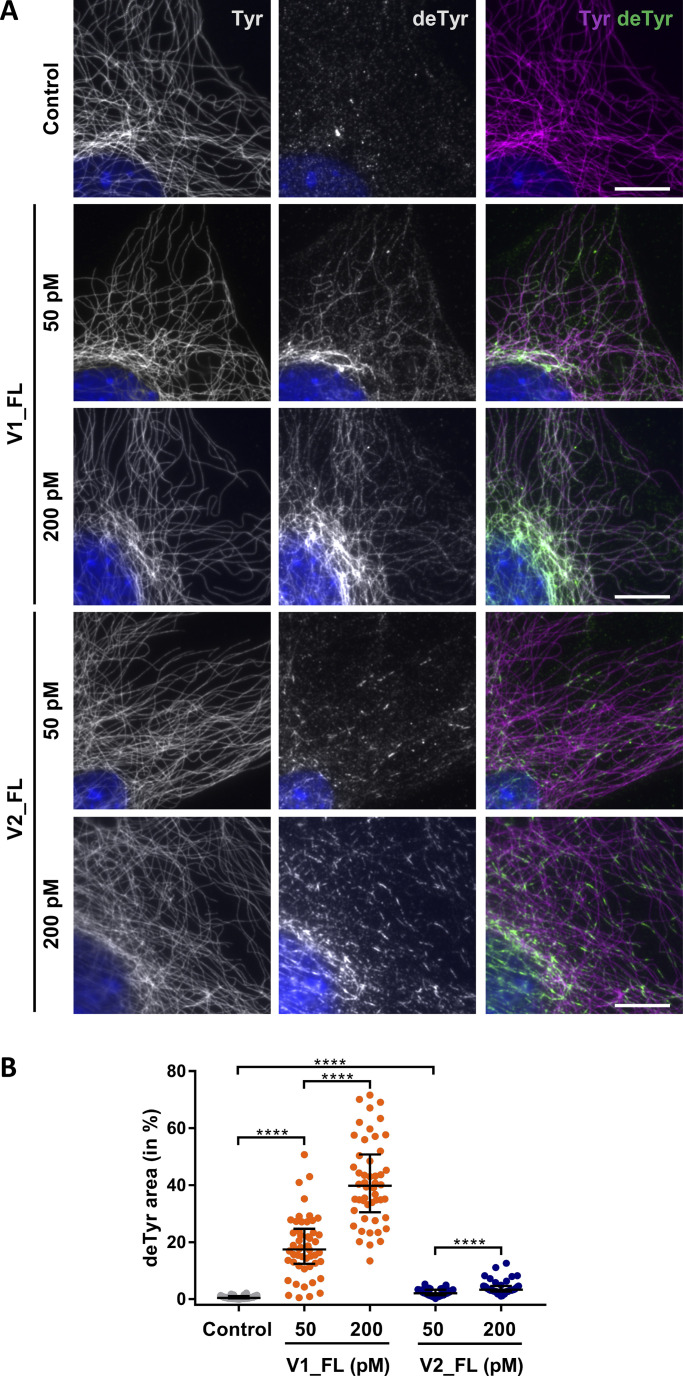
Figure 7.
VASH1–SVBP and VASH2–SVBP generate different detyrosination profiles in fibroblast cells. (A) Cultured MEFs were permeabilized in BRB80 supplemented with Triton X-100 and glycerol, incubated 30 min with recombinant enzymes (50 or 200 pM, as indicated), fixed in methanol at −20°C, and labeled with anti-tyrosinated (Tyr, magenta) and anti-detyrosinated (deTyr, green) tubulin antibodies to reveal detyrosination/tyrosination levels on microtubules. Scale bar, 10 µm. (B) Quantification of detyrosinated areas of microtubules in fibroblasts treated with VASH–SVBP enzymes as in A. Each point represents a different cell; at least nine cells from three independent experiments were analyzed. Data are represented as the median. Statistical significance was determined using the Kruskal-Wallis test, ****P < 0.0001.

