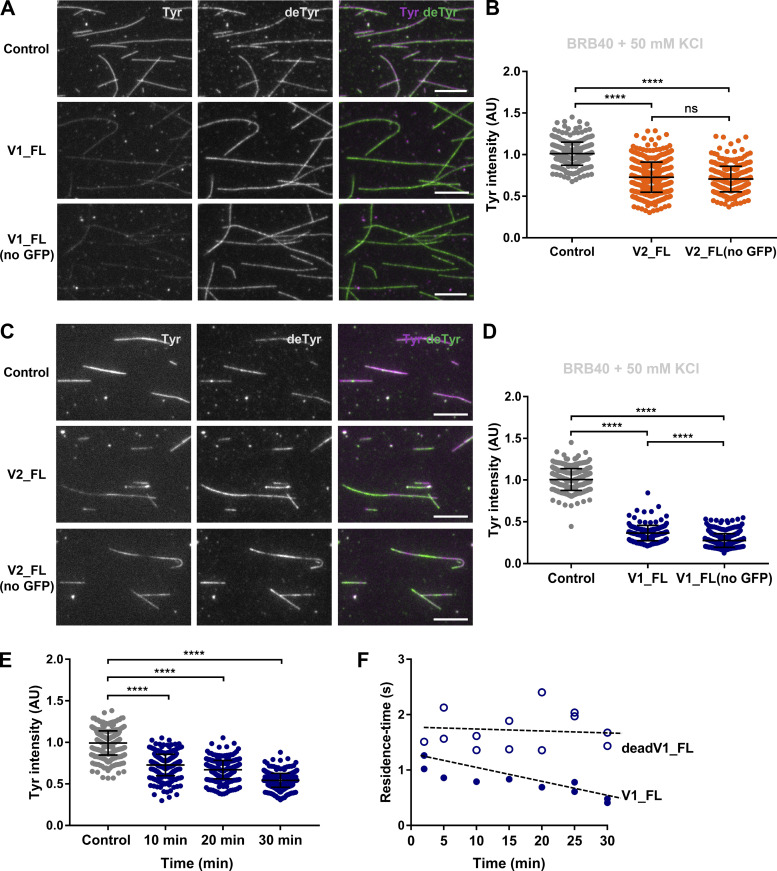
Figure S2.
Comparison of tubulin detyrosinating activity of sfGFP-tagged and untagged VASH–SVBP complexes , and evolution over the time. VASH1–SVBP and VASH2-SVBP (V1_FL and V2_FL) were produced with or without an sfGFP tag (see Materials and methods) and activity of 50 pM of the different complexes was measured by immunofluorescence in BRB40 with 50 mM KCl on Tyr-MTs. (A and C) Representative images of tyrosinated and detyrosinated α-tubulin pools of microtubules after 30 min incubation in the absence (control) or presence of the indicated enzyme complexes. Scale bar, 10 µm. (B and D) Analysis of tyrosinated-tubulin signals intensities of the experiments presented in A and C, respectively. Each point represents a microtubule (at least 150 microtubules were analyzed). Data are represented as the median with the interquartile range. Kruskal-Wallis test, ****P < 0.0001. (E) Analysis over 30 min (time course of a TIRF experiment) of the decrease in intensity of the tyrosinated-tubulin signals in the presence of active VASH1–SVBP. Each point represents a microtubule (at least 115 microtubules were analyzed). Data are represented as the median with the interquartile range. Statistical significance was determined using Kruskal-Wallis test, ****P < 0.0001. (F) Residence-time analysis of active and dead versions of VASH1–SVBP (V1_FL and deadV1_FL) during a TIRF experiment performed on the same day and in the same experimental conditions as in E. Each point represents the mean residence time of enzymes moving on at least four microtubules (one or two slides were analyzed per indicated time).

