Figure S3.
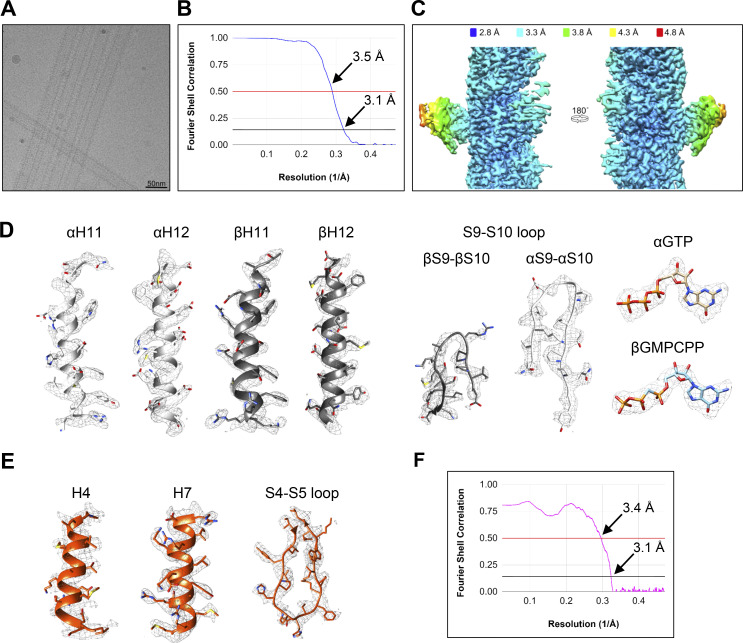
Cryo-EM data collection and processing. (A) Representative cryo-EM micrograph of microtubule–VASH2–SVBP specimens. (B) Map:map FSC resolution plot of the EM map corresponding to the microtubule–VASH2–SVBP complex (mask: two laterally associated αβ-tubulin heterodimers in complex with VASH2–SVBP). (C) Resolution map of the microtubule–VASH2–SVBP complex structure. (D and E) Exerts of the microtubule–VASH2–SVBP electron density map highlighting the quality of representative regions of αβ-tubulin, VASH2, and nucleotides. (F) Model:map FSC plot between the refined structure of the tubulin–VASH2–SVBP and the corresponding EM density map (mask: VASH2–SVBP).

