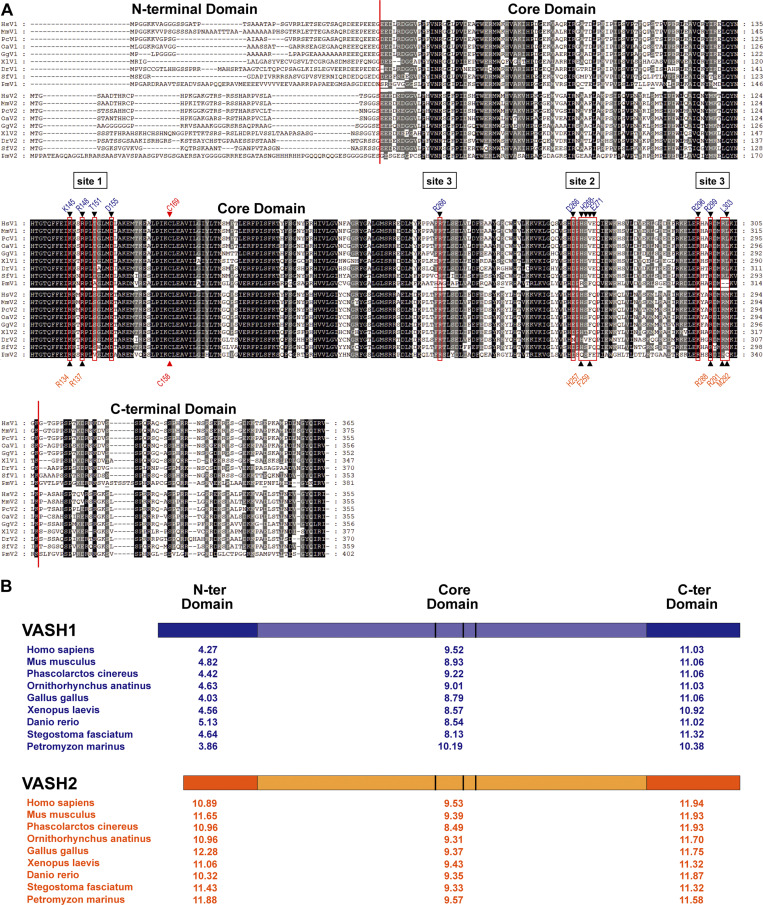
Figure S5.
Sequence alignments of VASHs. (A) ClustalWmultiple alignment of vertebrate VASH1 and VASH2 sequences (only a single VASH gene exists outside vertebrates). Sequences are placental Homo sapiens (human VASH1 NP_055724 and VASH2 NP_001287985), placental Mus musculus (mouse VASH1 NP_796328 and VASH2 NP_659128), monotremata Phascolarctos cinereus (koala VASH1 XP_020841880 and VASH2 XP_020863469), marsupial Ornithorhynchus anatinus (platypus VASH1 XP_001508093 and VASH2 XP_001510897), avian Gallus gallus (chicken VASH1 XP_015143201, XP_015139368), batrachian Xenopus laevis (Western clawed frog VASH1 XP_018085836 and VASH2 XP_018118075), teleost fish Danio rerio (zebrafish VASH1 XP_003200451 and VASH2 XP_005160797), cartilaginous fish Stegostoma fasciatum (zebra shark VASH1 JAFIRC010000009-deduced and VASH2 JAFIRC010000008-deduced), and cyclostomata Petromyzon marinus (sea lamprey VASH1 NC_046101-deduced and VASH2 XP_032818953). Alignment color code: black, dark gray, and gray shading correspond to 100, 80, and 60% of sequence homology, respectively. N-terminal, core, and C-terminal domains are separated by a vertical red line. Sites involved in microtubule binding are indicated. Black triangles located above and under the alignment show residues implicated in microtubule interaction of VASH1 (Li et al., 2020) and VASH2 (Fig. 3), respectively. These residues are red-boxed to highlight the sequence conservation. Red triangle shows the catalytic cysteine. (B) pI analysis of the VASHs domains during evolution. pI values of the N-terminal, core, and C-terminal domains were calculated based on the domain boundaries of the alignment shown in A. Color code is as in Fig. 5 C.

