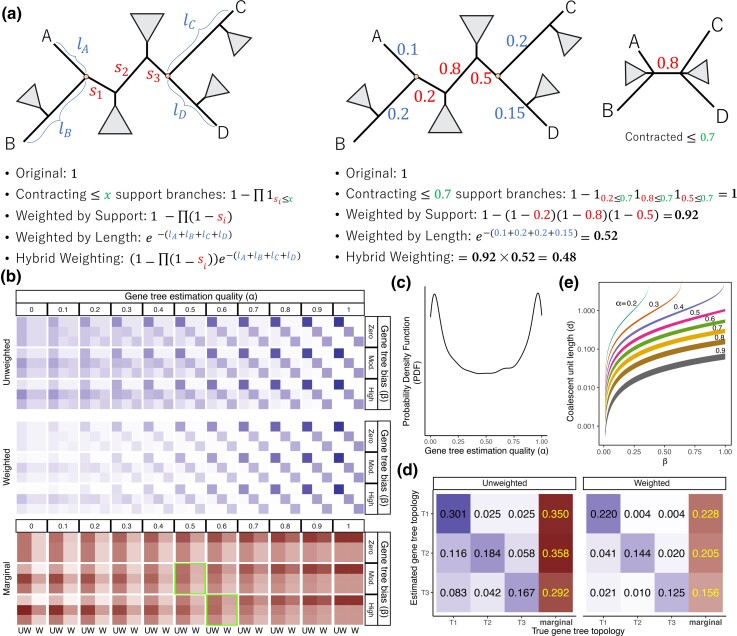
Fig. 1.
Weighted ASTRAL (wASTRAL) method. (a) Illustration of weighting methods. The generic formula and an example of weighting gene tree quartet . Trees are annotated with the support () of branches between anchors (hollow dots) and the substitution per site length of each leaf-to-anchor path (). (b–e) Impact of weighting under the MSC+Error+Support model for a quartet species tree. (b) Each element of each grid in the top and middle panels corresponds to a true (by column) and an estimated (by row) quartet gene tree topology. Diagonal elements correspond to no gene tree error. The first row/column represents the species tree topology. The second row/column corresponds to the topology toward which gene tree estimation is biased. The gene tree estimation quality ranges in . Gene tree estimation bias is set to zero, moderate (0.4), or high (0.6). Internal branch length is in coalescent units (CU). The color shades on the top panel show the joint probability of a true/estimated topology combination, which corresponds to the expected quartet scores in unweighted ASTRAL; the colors in the middle panel show the expected scores in wASTRAL-s. The row marginals of each grid are shown in the bottom panel: Each grid shows the expected score of each topology (rows) for unweighted ASTRAL (UW column) and weighted ASTRAL (W column). Note the reduced darkness of W columns as decreases, showing that poor gene trees contribute less. Two highlighted girds: the score is highest for the wrong (second row) topology without weights but is higher for the correct topology (first row) with weights. (c,d) In a toy example, we draw from the distribution (c) and show the joint () and marginal probabilities of topologies with and without weighting with moderate bias () and CU length. (e) For eight values of and every value of , the band shows the range of CU quartet internal branch lengths where unweighted ASTRAL is not consistent, but wASTRAL-s is.

