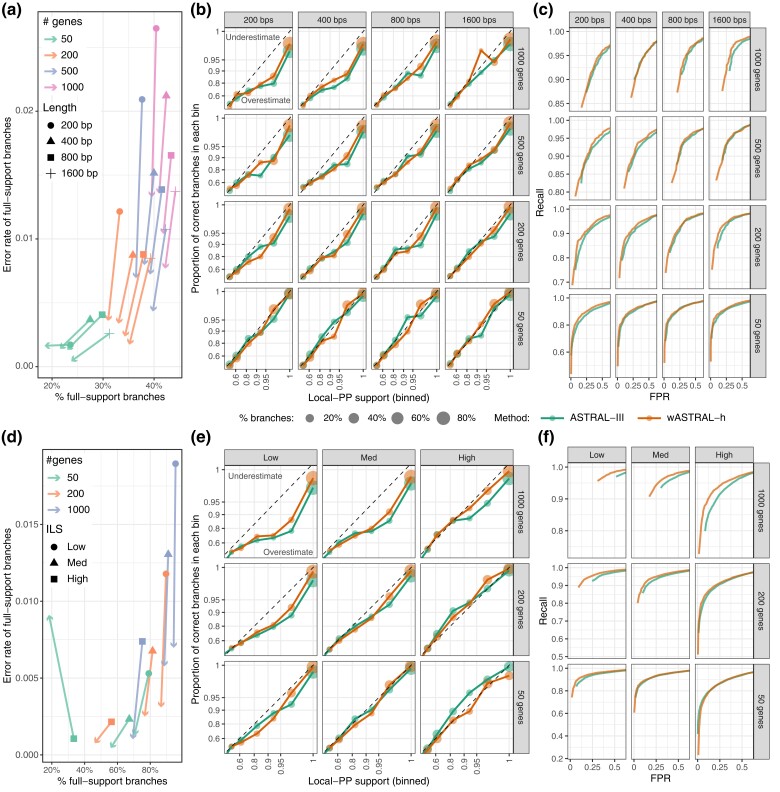
Fig. 3.
Support accuracy across (a–c) S100 dataset with and sequence length and (d–f) S200 dataset with and levels of ILS from low to high. (a,d) Change in 100% support branches. Each line shows the portion of full-support branches that are wrong (-axis) and the percentage of all branches that have full support (-axis) for wASTRAL-h (the arrowhead) and ASTRAL-III (other shapes). Arrows pointing downwards indicate less frequent errors in wASTRAL-h. (b,e) Support calibration. Branches are binned by their support, and for each bin, the percentage of branches that are correct are depicted versus the center of the bin. The dotted lines indicate ideal (calibrated) support. Top (bottom) triangle corresponds to the underestimation (overestimation) of support. (c,f) Receiver operating characteristic (ROC) curves where each dot corresponds to a contraction threshold, (“Evaluation Criteria”). See supplementary figs. S7–S12, Supplementary Material online.

