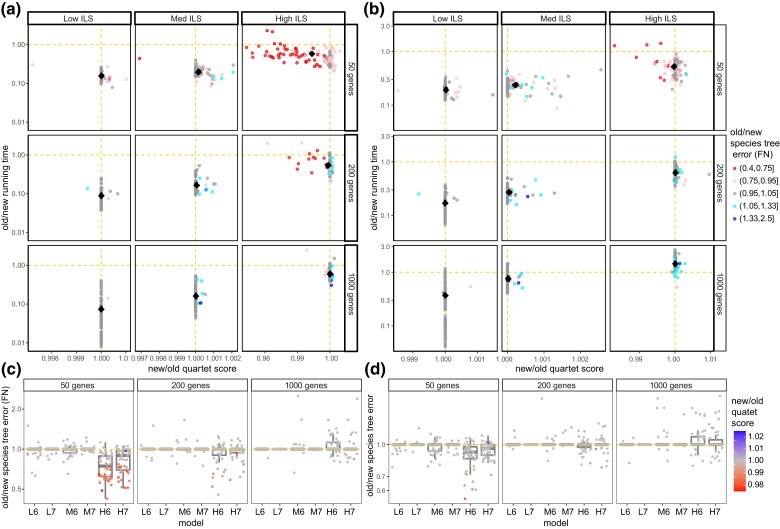
Fig. 4.
Comparison of the running time, quartet score, and species tree error (measured using FN) between the old DP-based (A3) and the new optimization algorithms (DAC), both run without weighting on the S200 dataset. (a and b) The ratio between the running time and quartet scores before (a) and after (b) randomly removing 5% of taxa from each gene tree; colors denote the ratio of species tree estimation error between the two methods. Note that the upper-right corner and blue color favor DAC. Results are separated by ILS levels from low to high and by . (c and d) The species tree topological error using the A3 algorithm divided by the DAC algorithm before (c) and after (d) randomly removing of 5% taxa from each gene tree with colors denoting the ratio of quartet scores. L6 to H7 indicate model conditions with low, medium, and high ILS with and rates.

