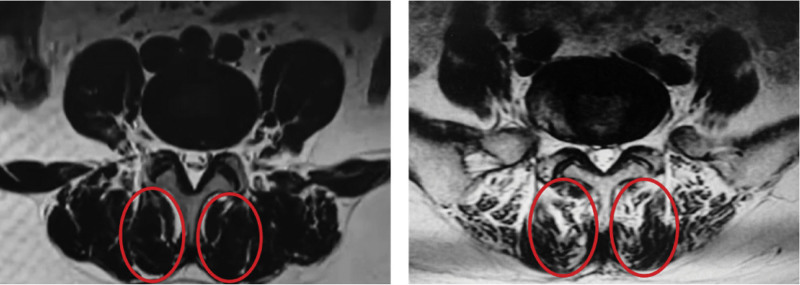
Figure 4.
Examples of different levels of fat infiltration in the multifidus muscle. The area in the solid line on the left shows multifidus fat volume < 50%, and the area in the solid line on the right shows multifidus fat volume > 50%. When the percentage of multifidus FI is > 50%, the patient has a significantly higher risk of low back pain and mobility disorders.[34]FI = fat infiltration.

