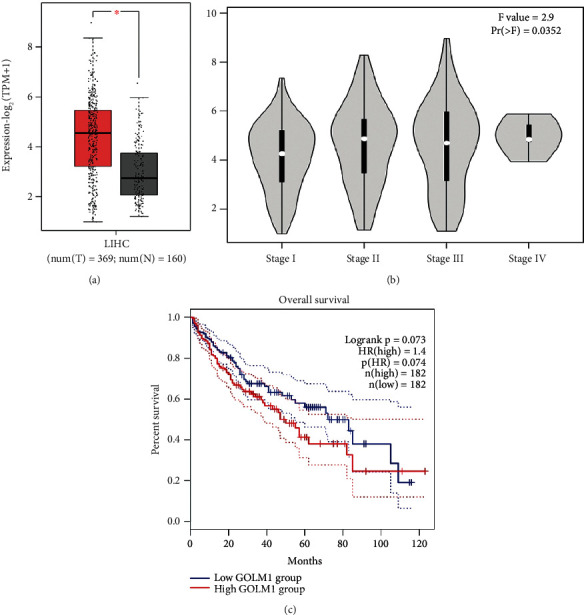
Figure 3.

Bioinformatics analysis results in GEPIA2. (a) GOLM1 is significantly upregulated in HCC samples (n = 369) compared to normal controls (n = 160). (b) GOLM1 expression by HCC staging. (c) Kaplan-Meier survival analysis for GOLM1; high (n = 182), low (n = 182).
