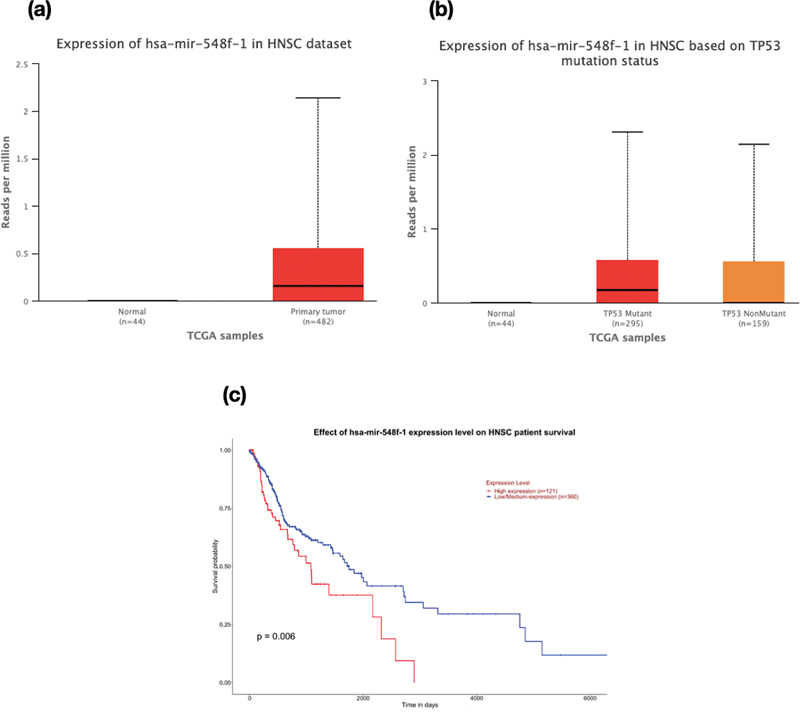
Fig. 3.

Box-Whisker plots demonstrating (a) the gene expression profile of hsa-mir-548f-1 ( p value = <10-12) in HNSC dataset, (b) the expression profile of hsa-mir-548f-1 based on mutation status (Normal vs TP53 mutant - p value = 1.81 × 10⁻¹⁰; TP53 mutant Vs TP53 non-mutant - p value = 5.28 × 10⁻²), (c) Kaplan-Meier survival plot showing significant difference in survival rate upon change in expression levels of hsa-mir-548f-1 ( p value = 0.006). A p value less than 0.05 is considered to be significant.
