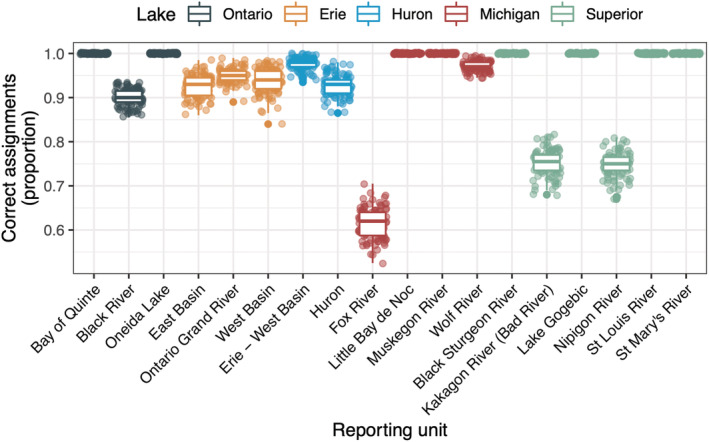
FIGURE 2.

The estimated genetic stock identification accuracy for each within‐Lake reporting unit (x‐axis) for the final GTSeq panel containing 500 SNP and microhaplotype markers. Reporting units are colored according to their corresponding Great Lake. Each point represents the proportion of individuals correctly assigned with a (pofZ) score of >0.7 to a given reporting unit in a single leave‐one‐out 100% mixture simulation (N = 99).
