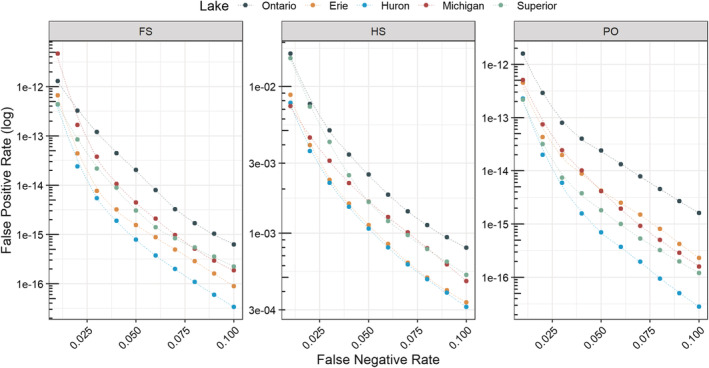
FIGURE 3.

The change in false‐positive detection rates (i.e., the rate of true‐unrelated pairs being identified as full‐sibling [FS], half‐sibling [HS], or parent‐offspring [PO] pairs) for 10 false‐negative rates (0.01–0.1; i.e, the rate of true full‐sibling, half‐sibling, or parent‐offspring pairs being identified as unrelated pairs) estimated separately for each lake. Note that the y‐axis differs between plots.
