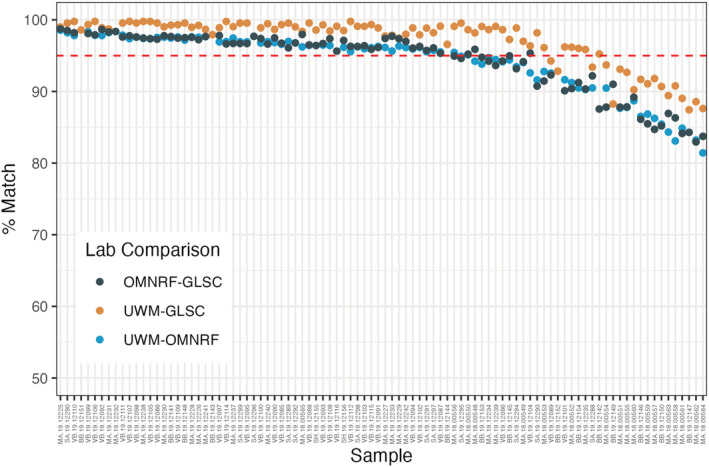
FIGURE 4.

Pairwise percent of identical genotype calls (y‐axis) made by individual laboratories (x‐axis) between sequencing runs conducted independently at the Ontario Ministry of Northern Development, Mines, Natural Resources and Forestry (OMNRF) laboratory at Trent University, the University of Wisconsin‐Milwaukee (UWM) and the USGS Great Lakes Science Center, Ann Arbor MI (GLSC). The dashed red line denotes 95% congruence. Individuals are ordered approximately by percent matching calls from highest to lowest.
