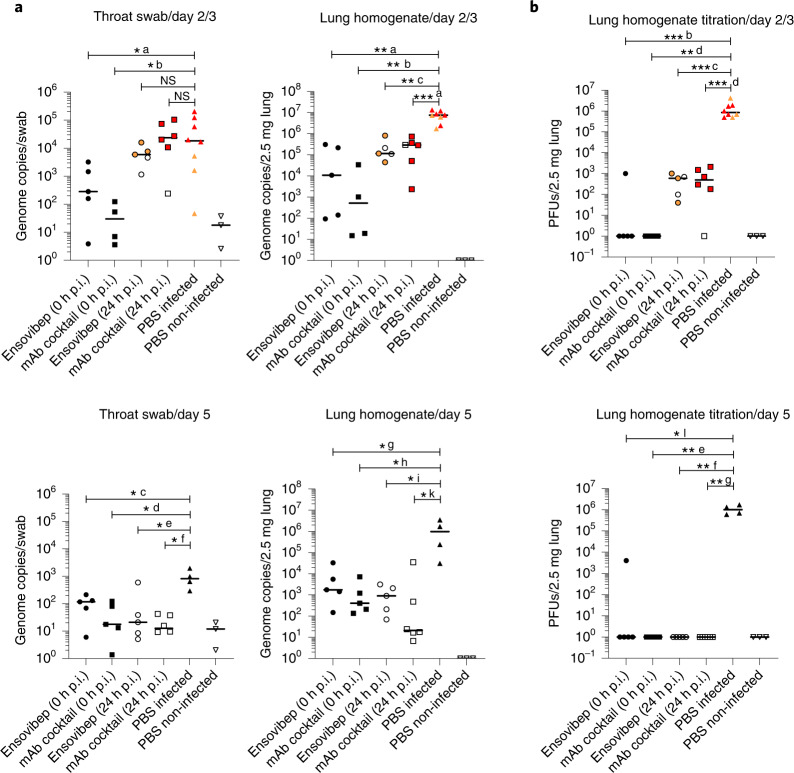
Fig. 5. Virology of SARS-COV-2-infected and treated Roborovski dwarf hamsters.
a, qPCR analysis of virus gRNA copy numbers in oropharyngeal swabs and lung homogenates at day 2/3 or day 5 p.i. b, Titration of replication-competent virus from lung homogenates as plaque assay on Vero E6 cells at day 2/3 or day 5 p.i. Red symbols: animals taken out of the study at day 2 due to severe clinical symptoms. Orange symbols: animals taken out of the study at day 3 due to severe clinical symptoms. Data are represented by the median and values for individual animals. Number of animals analyzed per treatment group at day 2/3; day 5 p.i.: ensovibep 0 hours: n = 5; 5 / mAb cocktail 0 hours: n = 4; 5 / ensovibep 24 hours: n = 5; 5 / mAb cocktail 24 hours: n = 6; 6 / placebo, infected: n = 8; 4 / placebo, non-infected: n = 3; 3. Some animals were excluded from the final analysis due to low drug exposure, likely due to a failure of i.p. injections. These animals were excluded from all analyses. Statistics: two-tailed Mann–Whitney test. P values: not significant (NS) = P > 0.05; *a: 0.0295; *b: 0.0162; *c: 0.0159; *d: 0.0159; *e: 0.0317; *f: 0.0100; *g: 0.0317; *h: 0.0159; *i: 0.0159; *k: 0.0190; *l: 0.0159; **a: 0.0016; **b: 0.0040; **c: 0.0016; **d: 0.0159; **e: 0.0079; **f: 0.0079; **g: 0.0048; ***a: 0.0007; ***b: 0.0008; ***c: 0.0008; ***d: 0.0007.

