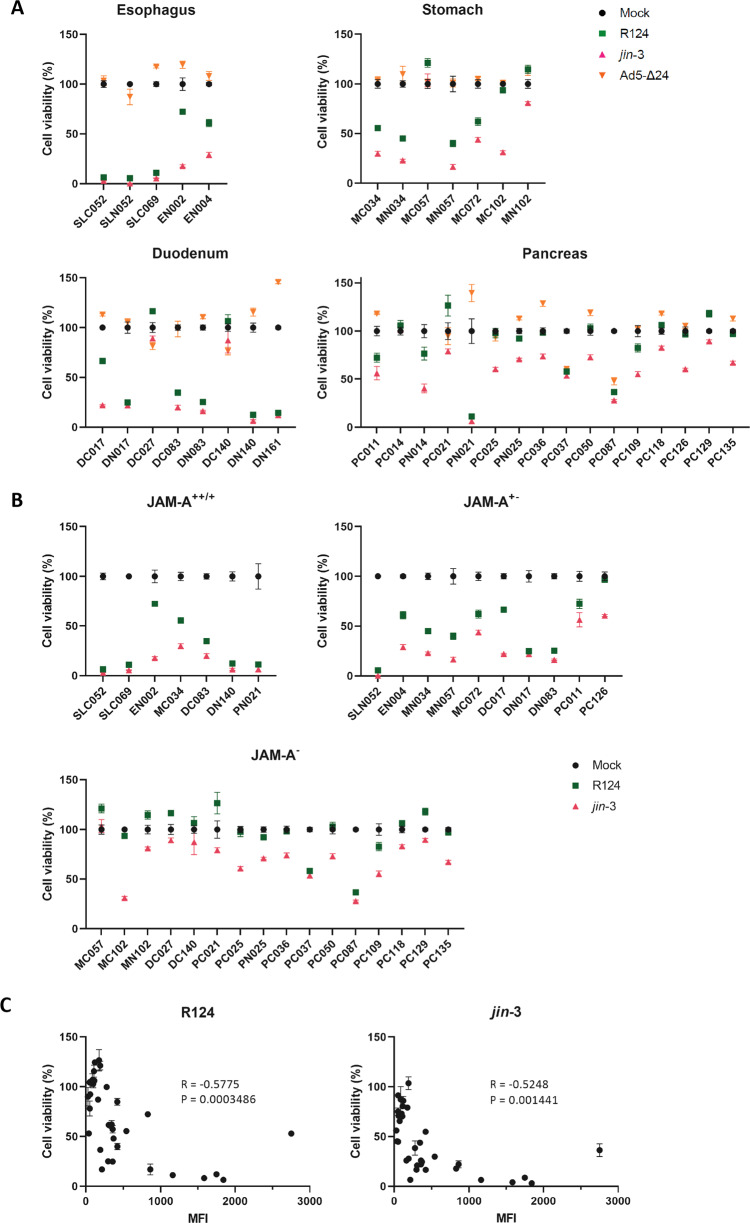
Fig. 1. Targeting of GI fibroblasts with oncolytic viruses.
A Oesophageal, gastric, duodenal and pancreas fibroblasts were infected with the indicated OVs at MOI 10 after which cell viability was determined 5 days post-infection. B GI fibroblast cell viability is shown according to the expression of JAM-A as determined by flow cytometry (++: MFI > 1500, +: MFI 500–1500, +/−: MFI 250-500, −: MFI < 250). C Pearson’s correlation of JAM-A MFI and cell viability as assessed by flow cytometry and WST-1 assay. Left panel shows correlation for R124 (R = −0.5775, p = 0.0003) and right panel for jin-3 (R = −0.5248, p = 0.0014). MFI = mean fluorescence intensity, C = CAF, N = tumor-adjacent.

