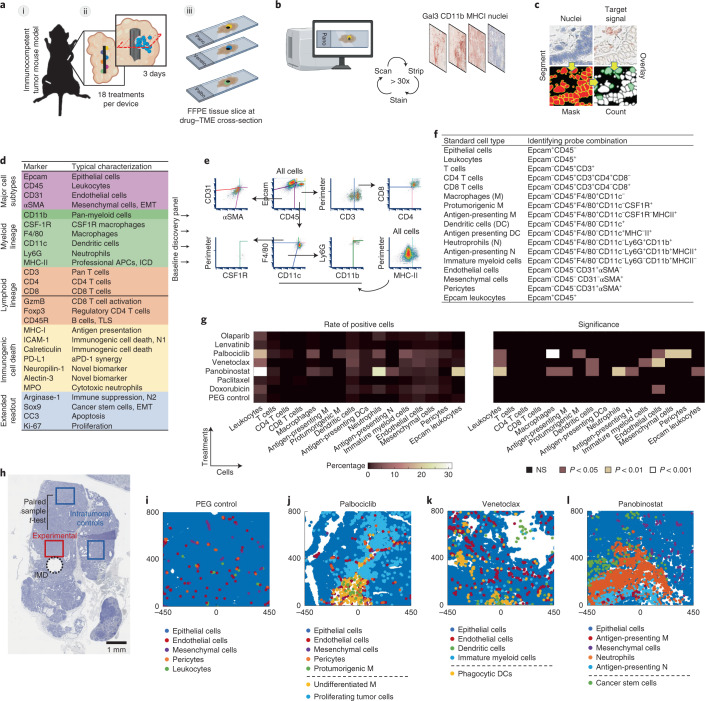
Fig. 1. MIMA components and testing of locally induced drug effects on TME.
a, Schematic of IMDs implanted into a multifocal mouse model of mammary carcinoma (i) showing treatments being released into spatially separated regions of tumors through passive diffusion (ii) and each condition being assayed individually at an angle perpendicular to the device (ii and iii). b, Schematic of the mIHC technique composed of iterative histological stripping, staining and scanning using digital scanning microscopy to detect the target set of markers. c, Acquired images are co-registered with nuclear staining, and the mean intensity of antibody staining within a mask is calculated for each cell to count marker-positive cells in a spatially intact tissue. d, Antibody list primary probe classification used to interrogate a broad range of tumor-intrinsic and TME states. e,f, Multidimensionality reduction in hierarchical gating (e) and list of probe combinations identifying standard cell types (f). g,h, Heat map of mean percentage of positive cells (left) and level of significance (right) at depicted targeted agents and chemotherapies (y axis), with PEG being the negative control (g). Total cell counts were between 3,000 and 5,000 cells per assay area and were matched ±300 total cells for paired samples: experimental versus control region as shown in the macroscopic view of the hematoxylin-stained tumor tissue implanted with IMD (black dashed circle; h). Minimum population proportion within 5% margin of error and 95% confidence level was set to 0.75% (represents 12 cells) to discriminate noise from specific signal. n = 3 wells from three tumors from 2–3 mice per treatment. Significance was calculated by paired sample one-tailed t-test. MMTV-PyMT mice with late-stage spontaneously growing tumors were implanted for 3 days. i–l, Presentation of selected standard cell types in x–y space. [0,0] coordinate is the drug-releasing site; direction of release is upward. Schematics in a,b were partly generated with BioRender. NS, not significant.

