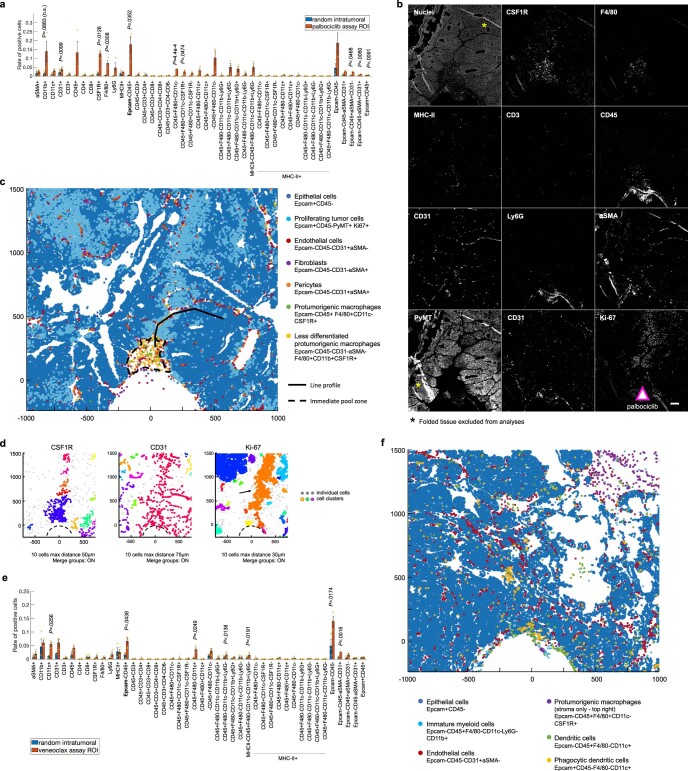
Extended Data Fig. 4. Locally induced TME changes at the palbociclib and venetoclax delivery sites.
a,e Quantification of single cell events using individual markers and marker combinations (including standard cell types). Bars are mean ± s.e.; n = 3 reservoirs from two to three tumors. MMTV-PyMT mice with late stage spontaneously growing tumors implanted with IMD for three days were used. Significance was calculated by paired sample one tailed t-test. b, Gray scale single channel images of depicted markers at the palbociclib-delivery reservoir. Arrow indicates the source and direction of drug release. Scale bar; 100 µm. c,f Presentation of key response cell types (biomarker combination displayed) in XY space. d, Distance based clustering of CSF1R, CD31 and Ki67 positive cells as a set of XY coordinates. Individual clusters were identified by minimum 10 cells within maximum distance 50 µm, 75 µm and 30 µm, respectively. Clusters were merged together if present within the maximum distance range. Coordinate [0,0] identifies the drug source. Direction of the drug release is upwards.

