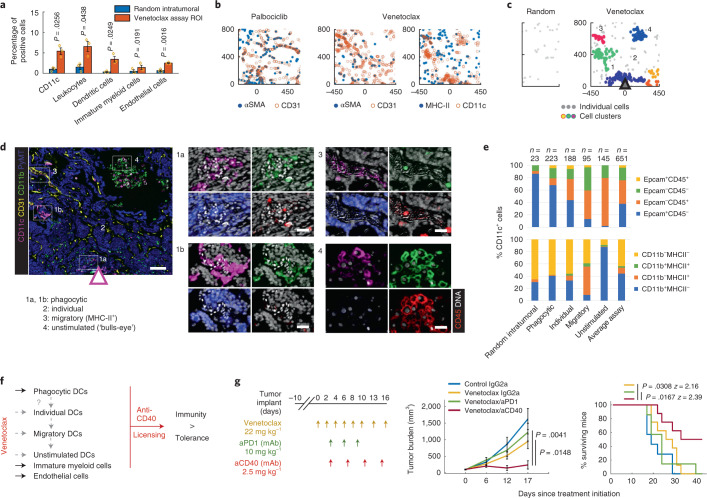
Fig. 3. Local TME changes induced by venetoclax and whole animal studies testing the combination treatment efficacy with the predicted anti-CD40 immunotherapy.
a, Quantification of single-cell events using individual markers and standard cell types. Bars are mean ± s.e.m.; n = 3 reservoirs. Significance was calculated by paired sample one-tailed t-test. For quantification of all cells, see Extended Data Fig. 4e. b, Marker co-expression in x–y coordinates in the palbociclib (left) and venetoclax (middle, right) assay areas. Each color-coded dot represents a marker-positive cell. Coordinate [0,0] identifies the drug source. The direction of the drug release is upward. c, Distance-based cluster analysis of CD11c+ cells as a set of x–y coordinates in random intratumoral (left) and venetoclax assay (right) regions. Clusters are displayed in randomized colors if at least ten cells are present within a maximum distance range of 50 μm; individual cells not meeting this criterion are shown as light gray points. d, Sample composite image of the key response markers at the venetoclax well. Arrow indicates the source and direction of the drug release. Numbered hashed boxes define the magnified area on the right where individual markers are overlaid on the DNA signal (in white). Scale bars, 100 μm (left) and 30 μm (right). The drug source and direction are presented by a triangle (c,d). e, Percentages of Epcam+ and CD45+ (top) and CD11b+ and MHC-II+ (bottom) cells within morphologically different CD11c+ DCs presented as a stack bar graph. The number of cells analyzed (n) is shown. Two to three regions of interest from two venetoclax samples were summed per each zone. f, Venetoclax model of response presented as an influence diagram. The drug induces recruitment of functionally different DCs, immature myeloid cells and enrichment of endothelial cells. Licensing the former two using an anti-CD40 agonist antibody shifts the balance from immune tolerance to anti-tumor immunity. Whether the different DC subsets evolve from one another or they are recruited as spatially separate entities remains to be determined (gray dashed arrows). g, Tumor burden measurements (left) and survival rates (right) of mice bearing E0771 tumors after systemic treatment using drugs as color-coded in the line graphs. Shown is mean ± s.e.m.; n = 7–8 mice per group. Significance was calculated by an unpaired two-tailed t-test with equal variance and by log-rank (Mantel–Cox) test for tumor burden rate and survival rate, respectively. Treatment dose and schedule are presented. For results using anti-PD-1 and anti-CD40 monotherapy, see Fig. 6c. mAb, monoclonal antibody.

