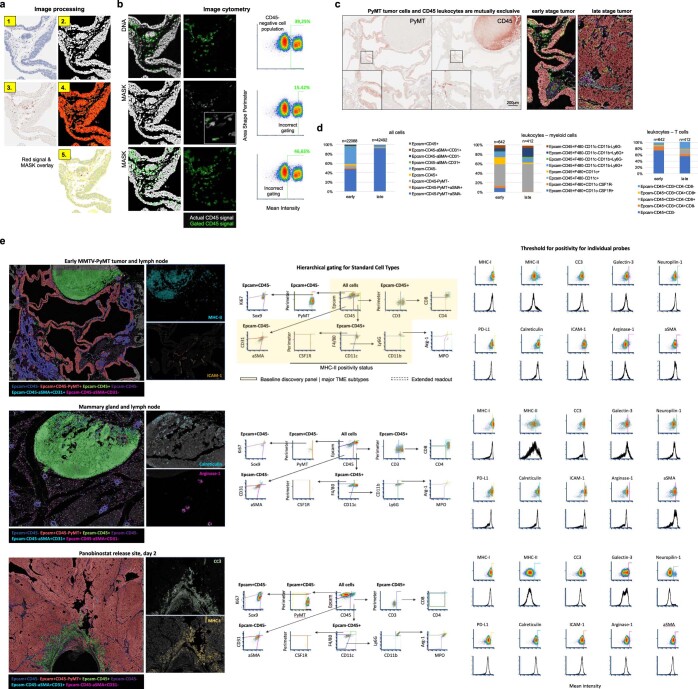
Extended Data Fig. 2. Analytical design to quantify single cell events in MIMA.
a, Image processing for image cytometry analysis composed of the following steps, briefly: hematoxylin staining (1) is colordeconvoluted and the signal is segmented using ImageJ watershed function (Schneider et al., 2012) to generate mask (2). Red AEC signal (3) mean intensity in a selection as defined by mask (4) is calculated for each cell (5). b, Pixel intensity measurements and shape size measurements are used to gate cells for positive marker expression (CD45 here). FCS Express 6 and 7 Image Cytometry Software (De Novo Software), was used to obtain accurate thresholding using the cell population shape and dimensions. Accurate gating strategy is also monitored through visual inspection (second column). c, Tissue section of an early MMTV-PyMT mammary carcinoma and adjacent lymph node was used to establish hierarchical gating strategies in image cytometry (in E) to define “standard cell types”. This for two reasons: presence of a lymph node in the same section offers the possibility to utilize mutual exclusivity (left) for reproducible signal thresholding. Second, early tumors provide with the opportunity to evaluate broader range of phenotypically distinct cell types as compared to late-stage tumors (right and d). d, Percentage of positive cells in early (<0.5 cm in longest dimension) and late stage (>1.5 cm in longest dimension) MMTV-PyMT tumors. Number of cells analyzed is shown; data is derived from one and two tumors for early and late tumor sample, respectively. e, Density plot of dimensionality reduction in hierarchical clustering to define “standard cell types”. The shape of the gates was designed to obtain quantitatively reproducible multiplex data, batch to batch, independent of the condition measured: early tumor and lymph node (top row), mammary gland and lymph node (middle row) and panobinostat implanted tumor sample two days post exposure (bottom row) are shown for comparison. For probes other than “standard cell types” (pleiotropic/undefined biology), threshold for positivity was determined manually using FCS Express 6 and 7 Image Cytometry software (b) and positive control tissue (Extended Data Fig. 1d–e). Sample pictures for marker positive cells; left.

