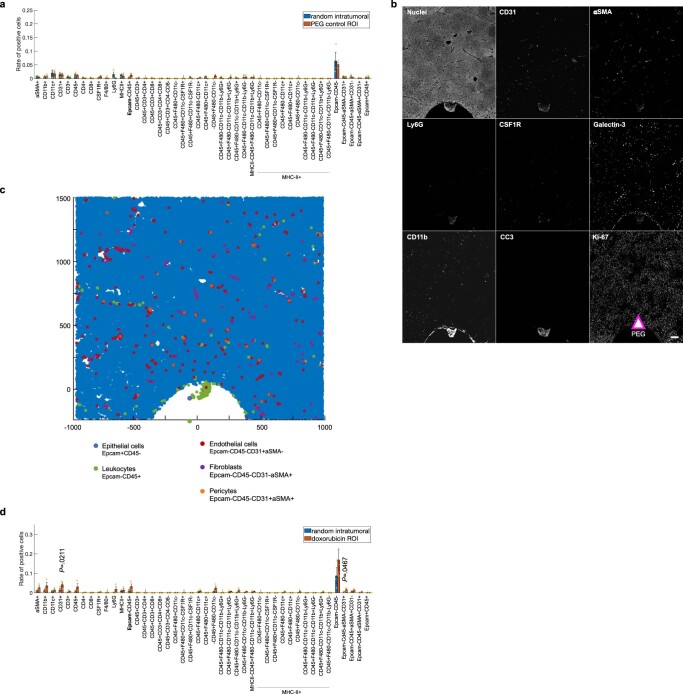
Extended Data Fig. 3. Locally induced TME changes at the PEG negative control and doxorubicin delivery sites.
a,d Quantification of single cell events using individual markers and marker combinations (including standard cell types). Total cell counts to define percentage of positivity were between 3,000 to 5,000 cells per assay area and were matched ± 300 total cells for paired samples (experimental vs control region). Minimum population proportion within 5% margin of error and 95% confidence level was set to 0.75% (represents 12 cells) to discriminate noise from specific signal. Bars are mean ± s.e.; n = 3 reservoirs from two to three tumors. MMTV-PyMT mice with late stage (d93-d100) spontaneously growing tumors implanted with IMD for three days were used. Significance was calculated by paired sample one tailed t-test. b, Gray scale single channel images of depicted markers at the PEG-delivery reservoir. Arrow indicates the source and direction of PEG release. Scale bar; 100 µm. c, Presentation of main response cell types (biomarker combination displayed) in XY space. Coordinate [0,0] identifies the drug source. The direction of the drug release is upward.

