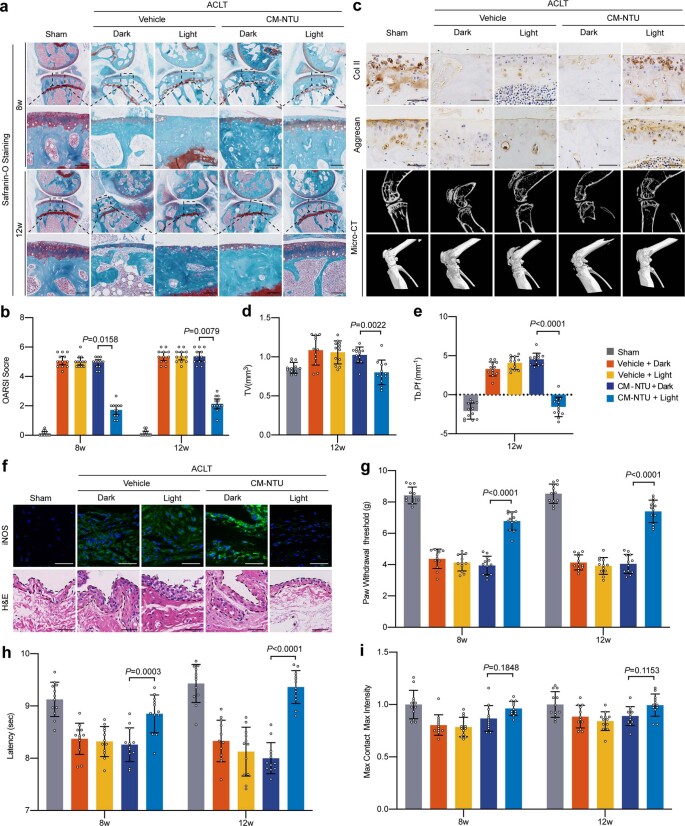
Extended Data Fig. 9. In vivo effect of CM-NTU treatment on osteoarthritis (OA) in 12-month-old male mice.
(a) Safranin O staining of joint sections at 8 and 12 weeks (scale bar, 100 μm). (b) Medial tibial plateau joint score based on the OARSI scoring system (n = 12, mean ± 95% CI). (c) Immunohistochemical staining (Col II and aggrecan) of joint sections at 12 weeks (scale bar, 50 μm), sagittal views of μCT of the knee joints, and three-dimensional images of the knee joints at 12 weeks. (d, e) For mice at 12 weeks after operation, quantitative analysis of TV (d) and Tb.Pf (e) in subchondral bone (n = 12, mean ± SD). (f) Immunofluorescence of iNOS and H&E staining of synovial membranes in CM-NTU-administered joints at 12 weeks (scale bar, 50 μm). (g, h) Electronic von Frey (g) and hot-plate (h) pain assays in mice at 8 and 12 weeks after the operation (n = 12, mean ± SD). (i) Gait assessment scores for maximum contact maximum intensity (right hind limb) in mice at 8 and 12 weeks after operation (n = 12, mean ± SD). n represents the number of mice per group. P values are indicated in graphs and were determined using the nonparametric Kruskal–Wallis test (b) or one-way ANOVA (d, e, g–i).

