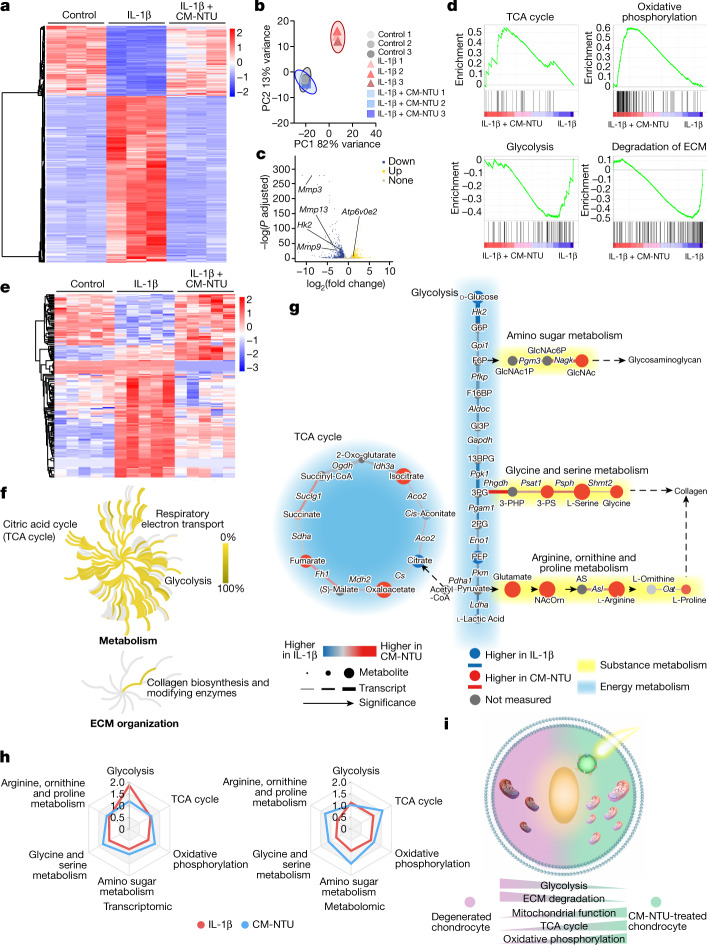
Fig. 4. CM-NTUs promote cellular metabolic reprogramming.
a, Heatmap showing differentially expressed genes in chondrocytes. Chondrocytes were stimulated with IL-1β followed by CM-NTU treatment for 6 h with red light irradiation (80 µmol photons m−2 s−1, 30 min). Three biological replicates are shown. b, PCA of genes in chondrocytes after treatment with IL-1β or with IL-1β and CM-NTUs in the light. Three replicates are shown. c, Volcano plots were generated representing genes related to oxidative phosphorylation, glycolysis and ECM degradation between the IL-1β plus CM-NTU group and the IL-1β group. Compared with the IL-1β group, the IL-1β plus CM-NTU group showed upregulated expression of 351 genes and downregulated expression of 784 genes (P-adjusted value by Wald test in DESeq2). d, Gene set enrichment analysis was performed to compare the gene sets involved in the TCA cycle, oxidative phosphorylation, glycolysis and ECM degradation between the IL-1β plus CM-NTU group and the IL-1β group. e, Heatmap representation and cluster analysis of metabolites in chondrocytes treated with IL-1β or with IL-1β and CM-NTUs in the light. Five biological replicates are shown. f, The influence of CM-NTU treatment on pathways related to metabolism and ECM organization. Topological graphs of these pathways are shown. Metabolomics data were analysed using the Reactome database. g, Concordant metabolomics integrated with transcriptomics analysis of the IL-1β plus CM-NTU with light group versus the IL-1β group. Connecting lines represent transcriptional expression of enzymes, circular nodes represent metabolite abundance and increased width indicates greater significance. h, Radar plot illustrating the pathway enrichment score of glycolysis, the TCA cycle, oxidative phosphorylation, amino sugar metabolism, glycine and serine metabolism, and arginine, ornithine and proline metabolism in the IL-1β group and the IL-1β plus CM-NTU groups. i, Schematic diagram of CM-NTU-driven metabolic reprogramming in degenerated chondrocytes.

