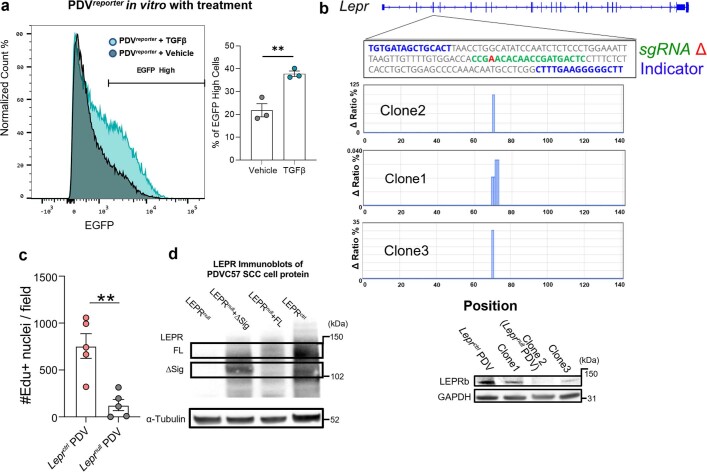
Extended Data Fig. 6. Lepr ATAC peak activity is sensitive to TGFβ and to Lepr knockout or overexpression.
a, Lepr cis-regulatory region reporter (see Fig. 2g and Extended Data Fig. 5f) was transduced into PDV SCC cells and tested for its sensitivity to TGFβ in vitro. Flow cytometry quantifications show that Lepr reporter-fluorescence is strongly accentuated in the presence of active recombinant TGFβ1 (n = 3, p = 0.0068). b, Leprnull PDVC57 SCC cells were generated by targeted CRISPR/CAS9 technology and validated by iSeq. Blue denotes sequence comparison region; green sgRNA; red, Lepr frameshift mutation in Clone 2. MiSeq analysis of Lepr targeted Clone 1 (which did not alter LEPR expression), and Clone 3 (which did reduce LEPR expression but not to the extent of Clone 2). Immunoblot (right) shows complete loss of LEPR protein in this clone, which was selected for further study. GAPDH is used as loading control. For gel source data, see Supplementary Fig. 2a. c, Quantifications showing reduced proliferation in Leprnull compared to LeprCtrl PDV tumours, as judged by EdU-labelling 2 h prior to harvesting. (n = 5 tumours per condition, p = 0.0024). d, Transduced cells are validated by pan-LEPR immunoblot analysis. Brackets denote expected sizes of full-length (FL) LEPR and Δsig LEPR, which lacks the LEPR-signalling domain. α-Tubulin is used as loading control. For gel source data, see Supplementary Fig. 2b. All statistics were using unpaired two-tailed Student’s t-test: ns, p ≥ 0.05); *, p ≤ 0.05); **, p ≤ 0.01; ***, p ≤ 0.001; ****, p ≤ 0.0001. Data are presented as mean ± s.e.m.

