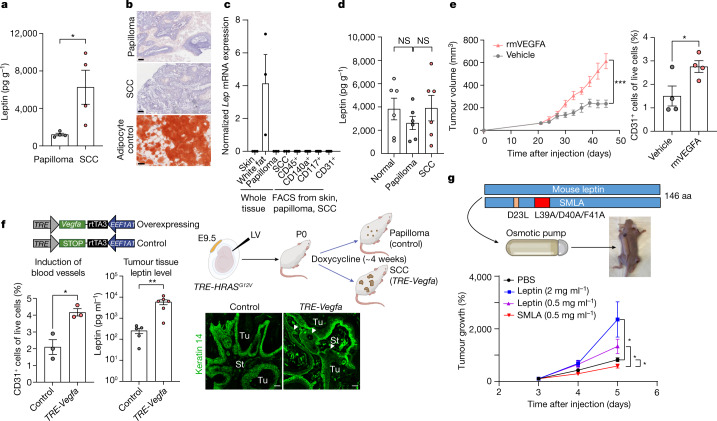
Fig. 4. Leptin levels increase in the malignant tumour microenvironment and are caused by elevated angiogenesis.
a, ELISAs. Leptin in tumour tissue lysates is elevated as papillomas progress to SCC. n = 4 tumours per stage. P = 0.0322. b, Oil red O staining shows no overt signs of mature adipocytes (red) within the stroma surrounding SCCs versus papillomas. Scale bars, 250 µm. c, Quantitative PCR reveals no significant Lep transcriptional differences in the tumour microenvironments of SCCs versus papillomas. The positive control is Lep mRNA from white adipose tissue beneath the normal trunk skin. n = 3 (each whole tissue condition), n = 5–9 (each FACS-isolated population). d, The levels of blood plasma leptin in normal, papilloma and SCC-bearing mice are appreciable, but do not significantly differ. n = 6 for each condition. e, Tumour growth and angiogenesis are enhanced by intradermal recombinant mouse VEGFA (rmVEGFA), injected every 3 days into PDV SCC tumours and assayed beginning at day 21 after grafting. VEGFA increases the CD31+ tumour vasculature, as judged by flow cytometry. n = 8 (left) and n = 4 (right) tumours per condition. P = 0.0002 for the end timepoint (left); P = 0.0440 (right). The vehicle control was PBS without mouse VEGFA. f, Elevated expression of SCC stem cell C2 signature gene Vegfa is sufficient to enhance local angiogenesis and elevate leptin levels in the tumour microenvironment. TRE-HRASG12V mice were transduced in utero with low-titre lentivirus containing EEF1A1-rtTA3 with TRE-Vegfa or TRE-STOP (schematic). The quantification shows that, after 4 weeks of doxycycline induction, CD31+ vasculature (n = 3 tumours per stage, P = 0.0133) and tissue leptin levels (n = 5, control tissues, n = 6, TRE-Vegfa tissues; P = 0.0093) are increased in tumours with CSCs that express elevated Vegfa. On the basis of the immunofluorescence analysis, VEGFA over-expressing tumours advance to invasive (arrowhead) SCCs when the controls are still papillomas. Scale bars, 50 µm. g, SCC tumour growth is sensitive to plasma leptin levels. Recombinant leptin or mutant SMLA leptin agonist (doses indicated) was delivered to the circulation by an osmotic pump and the effects on PDV SCC tumour growth were monitored for 5 weeks. n = 12 (PBS control), n = 8, (each LEP or SMLA condition). From top to bottom, P = 0.0121, P = 0.0194, P = 0.0392. Statistical analysis was performed using unpaired two-tailed Student’s t-tests (a and d–g). Data are mean ± s.e.m. (a and c–g). aa, amino acids.The diagrams in f and g were created using BioRender.

