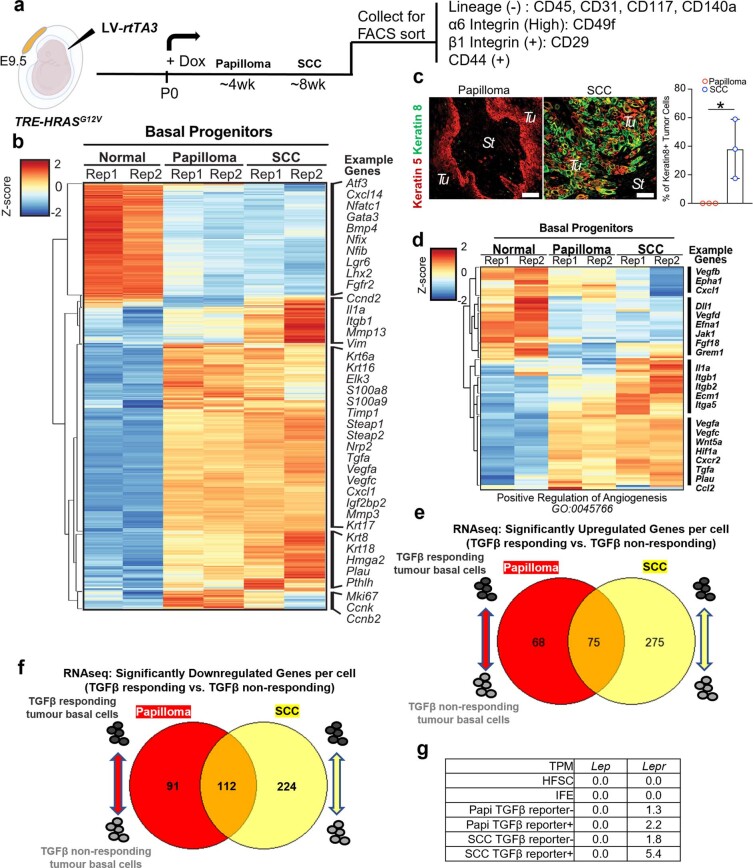
Extended Data Fig. 2. FACS-isolation and transcriptomic analysis of basal progenitors from normal skin, benign papilloma and SCC.
a, Experimental design for the tumour model as in Fig. 1a, used to purify basal progenitors from papillomas and SCCs. Basal cells (n = 2 mice per condition) are isolated by FACS using tumour basal cell markers (ITGA6, ITGB1, and CD44) with non-epithelial cell types (CD31, endothelial cells; CD45 pan-immune cells; CD117, melanocytes; CD140a, mesenchymal cells) excluded. b, Heatmap representation of bulk RNAseq of FACS-isolated basal progenitors from normal skin epithelia, papilloma, and SCC (in replicate) show significant molecular changes and stage-specific signatures during tumour progression. c, Immunofluorescence images show that keratin 8 positive tumour cells, as a proxy for the C2 SCC cancer-stem cell signature, are rare in the papilloma stage and much enriched in the invasive SCC stage. (n = 3 tumours per stage, p = 0.0334). Tu, tumour; St, stroma. Scale bars,50 µm. d, Heat map of the angiogenesis GO-Term. Note: RNAseq in Extended Data Fig. 2b and d, Rep1 SCC displayed mixed SCC-papilloma features. e, For high throughput RNA sequencing, two independent replicates of four FACS isolated populations were used. Venn diagram shows the differential expression of genes (DEG) analysis of RNAseq data from TGFβ responding tumour basal cells over their non-responding neighbours and compared between papilloma and SCC. DEG analysis yielded 68 TGFβ responding upregulated genes unique to the papilloma stage, 275 TGFβ responding upregulated genes unique to the SCC stage, and 75 upregulated genes shared by both stages. f, DEG analysis yielded 91 TGFβ responding downregulated genes unique to the papilloma stage, 224 TGFβ responding downregulated genes unique to the SCC stage, and 112 downregulated genes shared by both stages. g, Transcript levels of Lep are below the limits of detection in papillomas and SCCs. And Lepr are also not expressed in normal skin SCs. All statistics were using unpaired two-tailed Student’s t-test: ns, p ≥ 0.05; *, p ≤ 0.05); **, p ≤ 0.01; ***, p ≤ 0.001; ****, p ≤ 0.0001. Data are presented as mean ± s.e.m.

