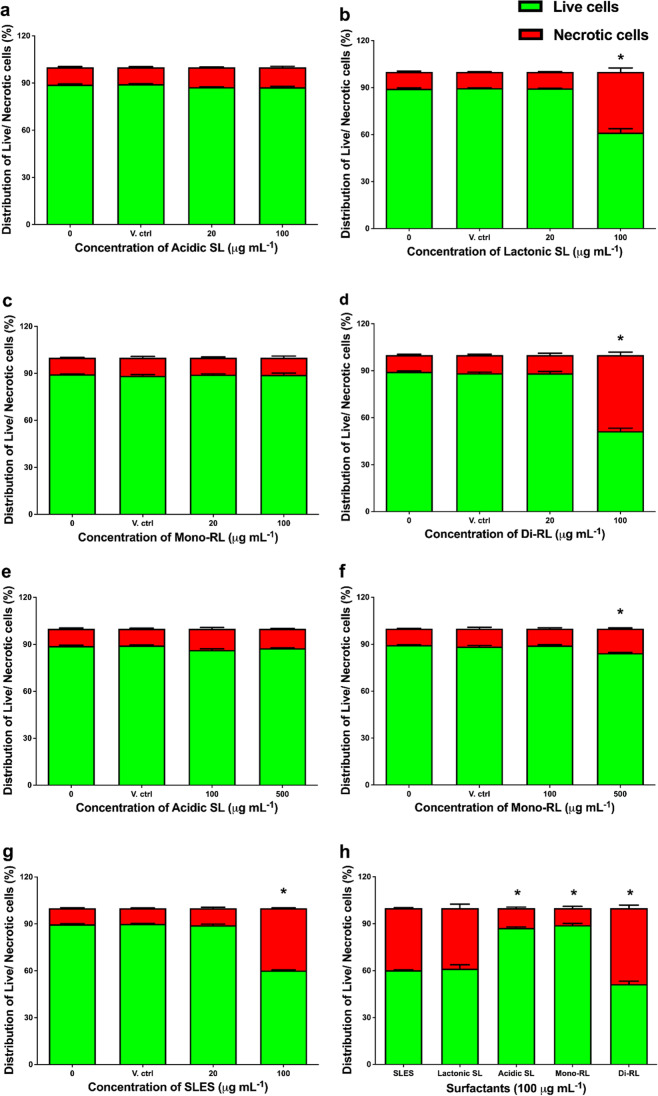
Fig. 3.
The use of AO/PI dual staining technique to assess the morphological pattern of cell death induced in HaCaT cells following treatment with each microbial glycolipid congener or SLES. Percentage of live cells (green) and necrotic cells (red) following treatment with 0, 20, or 100 μg mL−1 of acidic SL (a); lactonic SL (b); mono-RL (c); di-RL (d); 0, 100, or 500 μg mL−1 acidic SL (e); mono-RL (f); and 0, 20, or 100 μg mL−1 SLES (g); percentage live cells (green) to necrotic cells (red) following 100 μg mL−.1 treatment of each surfactant (h). Live/dead staining experiments were carried out independently three times, and three images per well were randomly selected and processed with ImageJ software for integrated density measurement. Statistical significance compared to untreated controls was determined using a two-way ANOVA followed by Šidák’s multiple comparison test. *p ≤ 0.05

