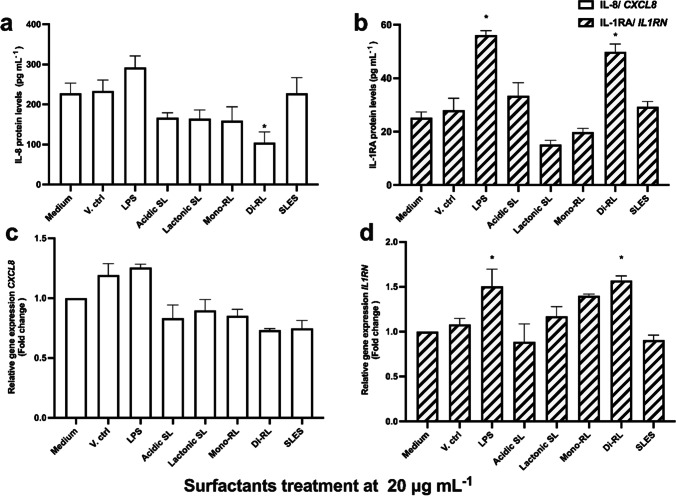
Fig. 4.
ELISA analysis of a IL-8 and b IL-1RA protein levels and RT-qPCR analysis of CXCL8 (c) and d IL1RN expression in HaCaT cells. The cells were treated with complete medium (Medium), 1% (v/v) methanol (V. ctrl), LPS (25 μg mL−1), glycolipid preparations, and SLES (20 μg mL−.1) for 24 h. Data are the mean results of four independent experiments; error bars represent standard error from the mean. Statistical significance was determined using a one-way ANOVA followed by Dunnett’s multiple comparison test. *p ≤ 0.05

