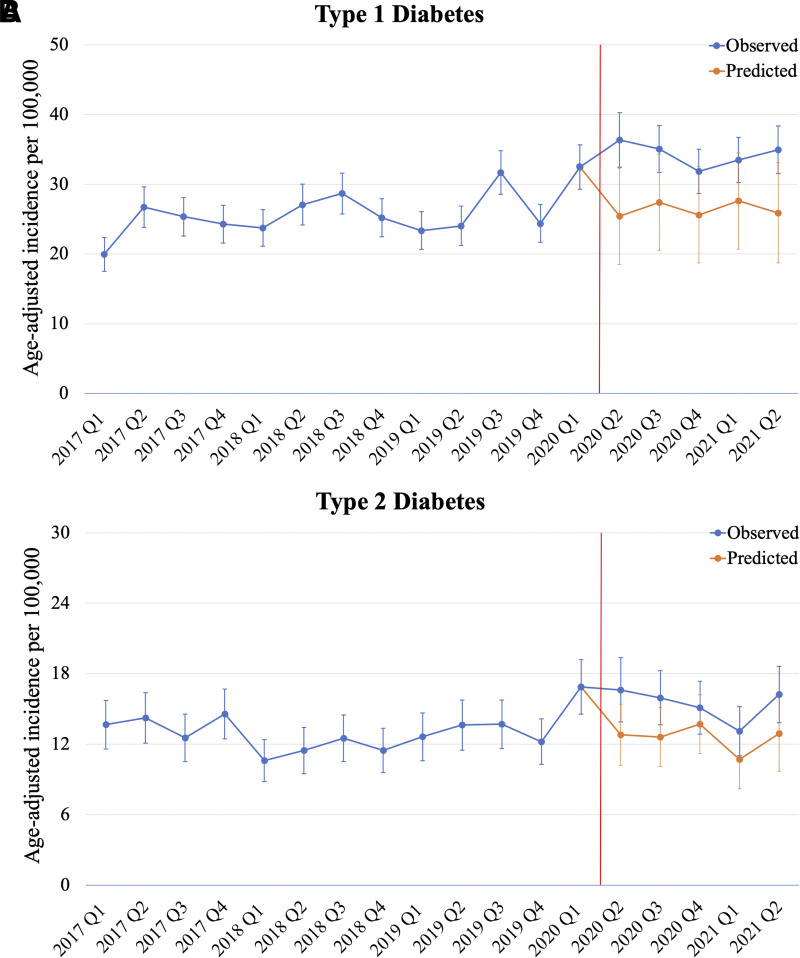
Figure 1.
Interrupted time series plots of quarterly age-adjusted diabetes incidence rates in Florida. Type 1 (A) and type 2 diabetes (B) age-adjusted incidence rates before and during the COVID-19 pandemic, which was declared a U.S. national health emergency in March 2020 (7). The trends in blue are incidence rates observed in OneFlorida+, and the trends in orange are ARIMA model–predicted incidence rates. The change in incidence rates before and after March 2020 was significant for both type 1 (coefficient 9.45; P = 0.0014) and type 2 diabetes (coefficient 4.30; P = 0.0088). Q, quarter.

