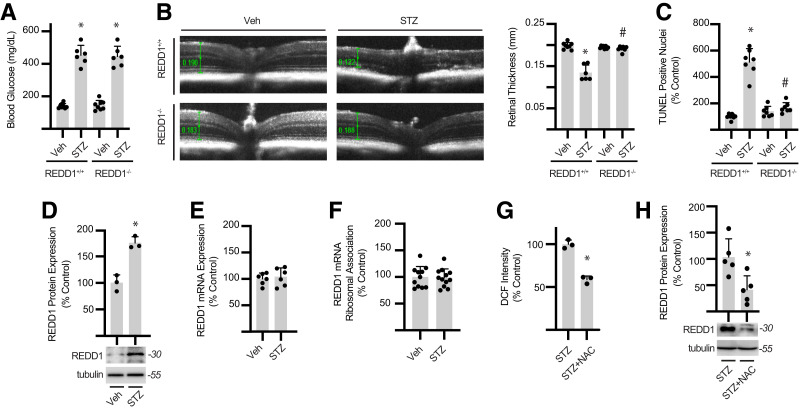
Figure 1.
Diabetes promotes retinal degeneration and increases REDD1 protein content. A: Diabetes was induced in WT (REDD1+/+) and REDD1-KO (REDD1−/−) transgenic mice by administration of STZ or a vehicle (Veh) control. Fasting blood glucose concentrations were evaluated. B: Retinal thickness was determined with optical coherence tomography. Retinal thickness was manually measured from the retinal nerve fiber layer to the photoreceptor outer segments as indicated by calipers (green). Representative images are shown. C: Retinal flat mounts were labeled with TUNEL-horseradish peroxidase, and TUNEL-positive nuclei were quantified. D: REDD1 and tubulin protein expression were evaluated in retinal lysates from REDD1+/+ mice by Western blotting. Representative blots are shown. Protein molecular mass in kDa is shown at right. E: REDD1 mRNA expression in retinal lysates was quantified by quantitative PCR analysis. F: Müller glia–specific expression of HA-tagged Rpl22 in the retina was achieved by crossing WT RiboTag mice to a PDGFRa-cre recombinase–expressing mouse, resulting in deletion of the WT exon 4 in the target cell population and replacement with the Rpl22HA exon. PDGFRa-Cre+; HA-Rpl22 mice were administered STZ or Veh. Ribosomes were isolated from retinal lysates of PDGFRa-Cre+; HA-Rpl22 mice by affinity purification. REDD1 mRNA association with ribosomes was determined by quantitative PCR. G: Oxidative stress was quantified by evaluating DCF fluorescence in retinal lysates. H: REDD1 and tubulin protein expression in retinal lysates was evaluated by Western blotting. Diabetic mice received ∼2 g/kg NAC daily via drinking water (G and H). Data are represented as mean ± SD. *P < 0.05 vs. Veh or no NAC treatment; #P < 0.05 vs. REDD1+/+.

