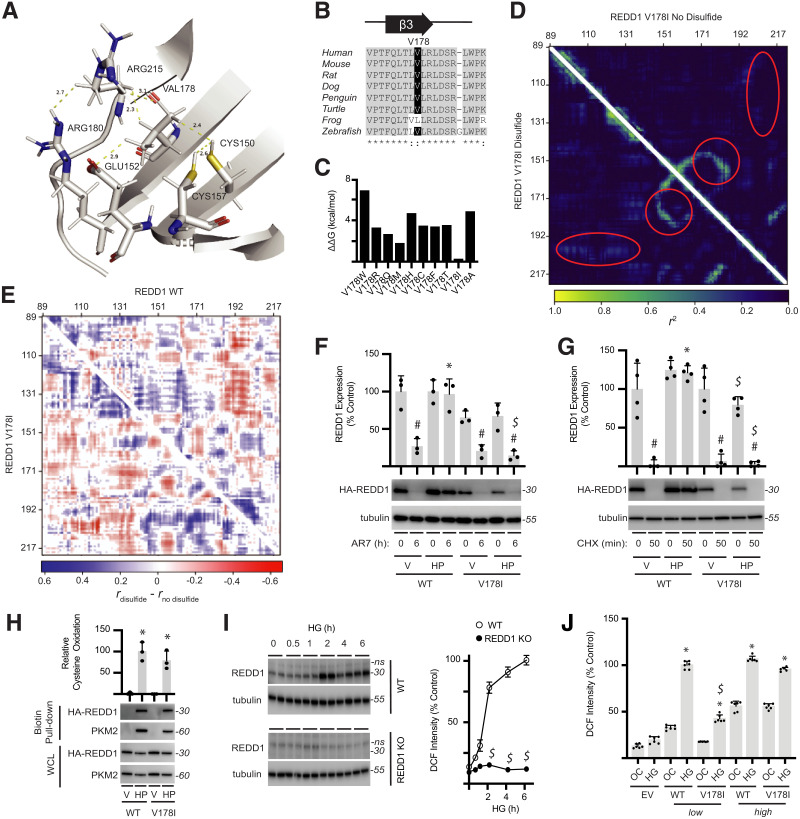
Figure 6.
Disruption of REDD1 allosteric regulation prevents REDD1 stabilization and hyperglycemia-induced oxidative stress. A: Side chains of C150/C157 in REDD1 coordinate with V178. B: REDD1 V178 exhibits sequence conservation among vertebrates. C: Eris web server was used to predict the stability of REDD1 V178 variants. D: DMD simulations were performed on REDD1 V178I in the absence (top triangle) and presence (bottom triangle) of the C150/C157 disulfide. E: Comparison of DMD simulations for REDD1 WT vs. V178I, with and without the disulfide, supported disruption of protein-wide allostery in the V178I mutant. F and G: HA-tagged REDD1 WT or V178I variants were expressed in REDD1-KO MIO-M1 cells. Cells were exposed to vehicle (V) or H2O2 (HP) for 2 h prior to administering AR7 (F) or cycloheximide (CHX) (G), and REDD1 expression was evaluated by Western blotting. Representative blots are shown. Protein molecular mass in kDa is indicated at right of blots. H: REDD1 oxidation was evaluated by biotin switch assay. PKM2 was evaluated in biotin pull-downs as a positive control. HA-REDD1 and PKM2 expression in whole-cell lysate (WCL) was determined by Western blotting. I: WT and REDD1-KO MIO-M1 cells were exposed to medium containing 30 mmol/L glucose (HG) for up to 6 h, and ROS were visualized with DCFDA. REDD1 and tubulin expression were evaluated by Western blotting, and DCF fluorescent intensity was quantified (n = 3). J: WT and V178I REDD1 variants were expressed at a low (12.5 ng of plasmid) or high (100 ng of plasmid) level in REDD1-KO MIO-M1 cells. Cells were exposed to medium containing 30 mmol/L glucose (HG) or 5 mmol/L glucose plus 25 mmol/L mannitol as an osmotic control (OC) for 24 h. DCFDA was used to quantify ROS in cells. Data are represented as mean ± SD. *P < 0.05 vs. V; #P < 0.05 vs. no treatment; $P < 0.05 vs. WT.

