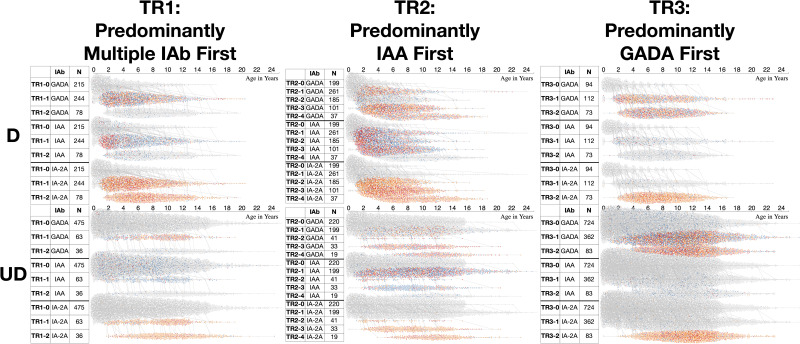
Figure 1.
Visualization of the entire data set by trajectory and IAb level comparing diagnosed and undiagnosed individuals and illustrating the differences. Three autoimmune trajectories and their component states overlaid with autoantibody levels toward type 1 diabetes. The diagram includes three subfigures summarizing the three respective trajectories and their component states overlaid with the IAb levels: TR1, TR2, and TR3. Each subfigure consists of two plots (top, bottom); the top plot shows trajectories for the diagnosed (D), and the bottom shows those for the undiagnosed (UD). The table on the left includes three columns: 1) component state label, 2) IAb type (GADA, IAA, or IA-2A), and 3) the total number of participants per state (row). The waterfall chart on the right shows visits (dots) colored according to the IAb level (gray, L0; blue, L1; orange, L2; red, L3). y-axis represents component states, and x-axis represents age of participants in years. In TR1, most diagnosed children advance from TR1-0 (IAb negative) to TR1-1 (positive for multiple IAb) and TR1-2 (IA-2A positive). The distributions of autoantibody levels over age show higher proportion of IAA L3 (red) in early age of the diagnosed participants compared with the undiagnosed participants. In TR2, the diagnosed participants frequently have IAA L3 (red) at early ages across all positive states, whereas the undiagnosed participants have fewer IAA positive visits and those with L3 are spread across ages. In TR3, both the diagnosed and the undiagnosed participants advance to IAb-positive states, TR3-1 and TR3-2, but the timing is later for the undiagnosed.

