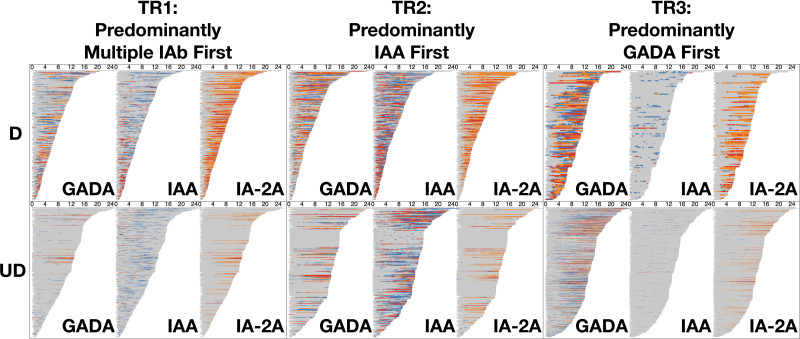
Figure 3.
Development of autoantibody levels and dwell times for individual participants sorted by duration of follow-up. The diagram includes six panels (two rows and three columns) summarizing the dwell time of individual participants at each autoantibody level (gray, L0; blue, L1; orange, L2; red, L3) for three IAb (GADA, IAA, IA-2A) over their ages in years (x-axis) per trajectory (column) and per diagnosis (row). In each panel, we sorted participants (horizontal bars) by their age at last observation with increasing order from top to bottom. Overall, the undiagnosed participants have longer follow-up time as seen in the horizontal length of bars across the board. Most of the diagnosed participants tend to show dynamic changes of autoantibody levels and longer dwell times at higher levels over the follow-up period compared with the undiagnosed participants. In all trajectories an evolution to high levels of IA-2A frequently precedes diagnosis. D, diagnosed; UD, undiagnosed.

