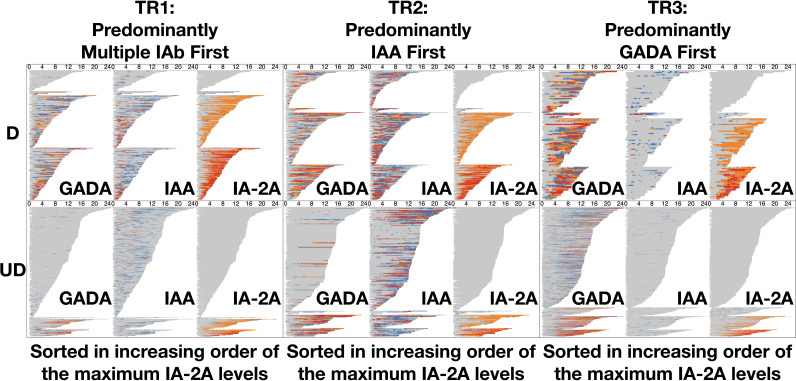
Figure 4.
Development of autoantibody levels and dwell times for individual participants sorted by their maximum IA-2A level. The diagram includes six panels (two rows: diagnosed, undiagnosed; three columns: TR1, TR2, TR3) summarizing the dwell time of individual participants at each autoantibody level (gray, L0; blue, L1; orange, L2; red, L3) for three IAb (GADA, IAA, IA-2A) over their ages per trajectory per diagnosis. In each panel, participants in each trajectory (column) are sorted by the maximum level of IA-2A with increasing order from top to bottom. More than one-half of diagnosed participants across the three trajectories reach high IA-2A levels (L2, L3) during follow-up. On the other hand, a majority of undiagnosed participants across the three trajectories stay IA-2A negative (L0) during follow-up. D, diagnosed; UD, undiagnosed.

