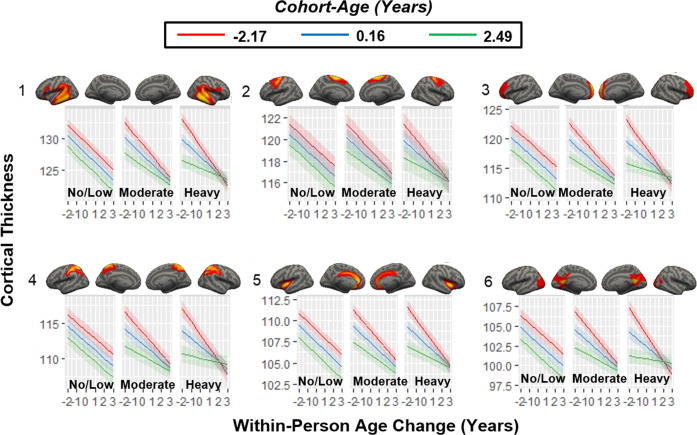
Fig. 2. Three-way interactions between drinking class, cohort-age and within-person age change.
The rates of within-person age-related cortical thickness declines are similar across age cohorts in no/low drinkers, faster in the younger cohort and slower in the older cohort in moderate drinkers, and fastest in the younger cohort and slowest in the older cohort in heavy drinkers for all patterns (β-values = 0.065–0.182, t-values = 2.842–8.002, q-values < 0.01) except for pattern 7 (β-value = 0.011, t-value = 0.724, q-value = 0.469). The x-axis represents the within-person age change in years.

