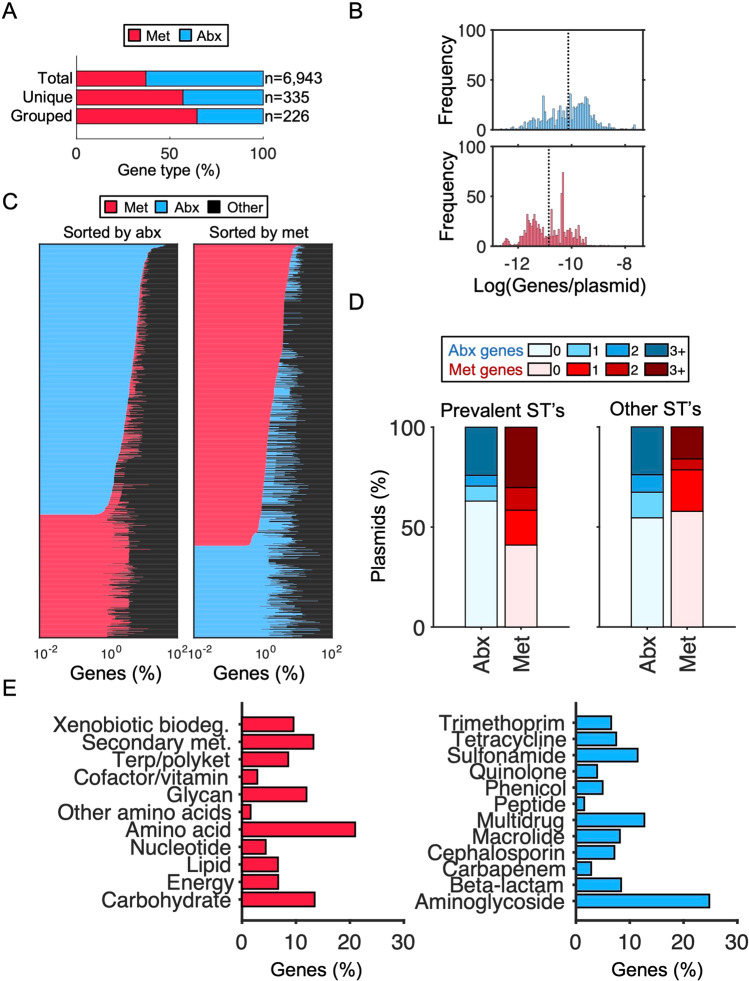
Fig. 2. Characterization of antibiotic resistant and metabolic genes.
A Relative abundance of gene type. Percentage of antibiotic resistance genes (Abx) compared to metabolic genes (Met). Percentages are calculated from the total of the corresponding bar. “Total” corresponds to all annotated antibiotic resistance and metabolic genes, “Unique” corresponds to all unique gene variants, and “Grouped” refers to those from the “Unique” category further grouped by nucleotide variants (e.g., different variants of the same gene are grouped together). B Average gene type per plasmid. Histogram distributions show the number of genes (antibiotic resistance or metabolism) per total number of genes on each plasmid. Blue indicates frequency of metabolic genes per plasmid (top) and red indicates frequency of antibiotic resistance genes per plasmid (bottom). Black dashed line indicates the average number of gene type per plasmid for comparison. C Proportion of gene types on plasmids. Left and right panels show stacked horizontal bar graphs where the x-axis is the percentage of genes on each plasmid. Blue indicates antibiotic resistance genes, red indicates metabolic genes, and black indicates all other gene types. Plasmids are sorted top to bottom by antibiotic resistance (left) or metabolic (right) gene abundance. Any plasmid with neither an antibiotic resistance nor metabolic gene was removed for visibility. D Proportion of gene types by ST. Stacked bar graphs show percentage of plasmids with the corresponding number of genes belonging to antibiotic resistance or metabolic gene types. Plasmids are divided into the four categories of encoding 0, 1, 2, or 3+ metabolic genes (shades of red from light to dark) and antibiotic resistance genes (shades of blue from light to dark). Data for prevalent STs (131, 11, 73, 95) and other STs are shown separately (left and right panels, respectively). E Percentage of metabolic and antibiotic resistance functions. Red indicates genes belonging to metabolic categories as determined by KEGG (left) and blue indicates known antibiotic classes (right).

