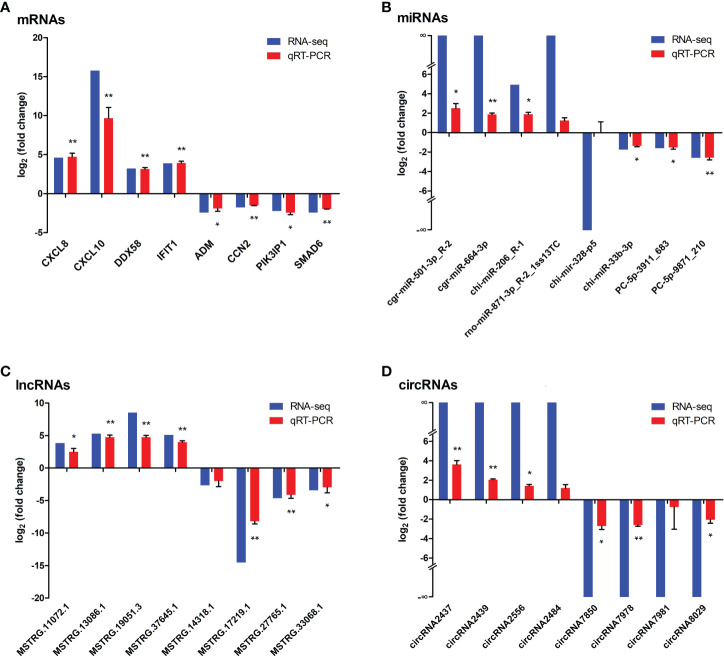
Figure 10.
Verification the expressions of (A) dif-mRNAs, (B) dif-miRNAs, (C) dif-lncRNAs, and (D) dif-circRNAs using qRT-PCR, respectively. Blue and red bars represented the whole transcription sequencing results and qRT-PCR validation results respectively, whereas qRT-PCR validation results were displayed as mean log2 (fold change) ± SD with error bars from three independent experiments. Symbols * and ** indicated the difference between the indicated groups was significant (p-value < 0.05) or very significant (p-value < 0.01 respectively.

