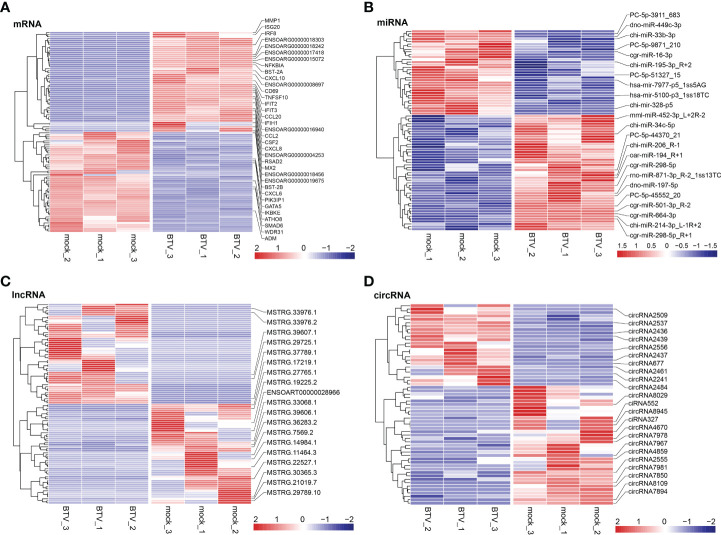
Figure 3.
Hierarchical cluster analyses of (A) dif-mRNAs, (B) dif-miRNAs, (C) dif-lncRNAs, and (D) dif-circRNAs between BTV-1-infected and mock-infected OA3.Ts cells. The top 50 upregulated and downregulated dif-mRNAs and dif-lncRNAs, as well as all dif-miRNAs and dif-circRNAs were selected and displayed in the heatmaps. The color of the color blocks from blue to red represented the dif-RNAs expression levels from downregulated to upregulated. Several important dif-RNAs were labeled to the right of the corresponding heatmaps.

