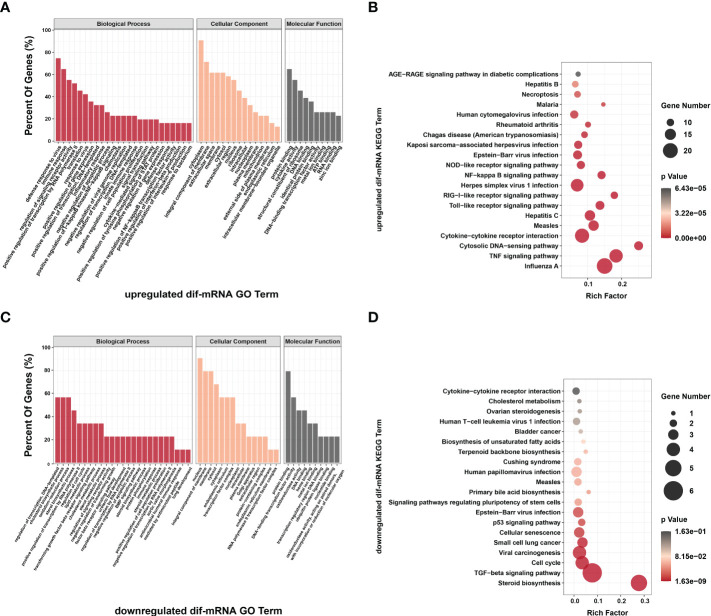
Figure 9.
Go annotation and KEGG enrichment of upregulated and downregulated dif-mRNAs displayed in the extracted six modules. Top 50 GO terms and top 20 KEGG pathways were shown. (A, C) The height of bar chart represented the ratio of enriched dif-mRNAs under specific GO terms. (B, D) Rich factor of the KEGG scatter diagrams indicated the ratio of dif-mRNAs enriched to the specific pathway. The size of and the color of the solid circulars represented the number of enriched dif-mRNAs and significance of the enrichment, respectively.

