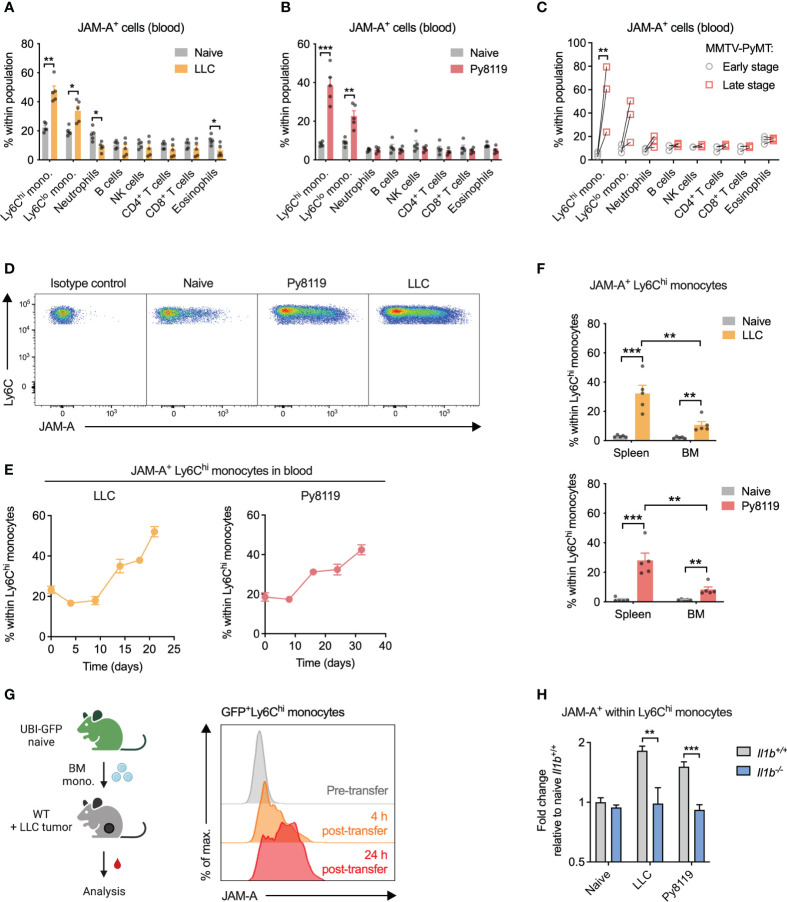
Figure 1.
Cancer-associated inflammation promotes upregulation of JAM-A on peripheral monocytes in an IL-1β-dependent manner. (A) Frequency of JAM-A+ cells within the most abundant immune cell populations in the blood of mice with sc. LLC tumors (21 days post-engraftment, 1678 ± 212mm3 tumor volume). (B) Same as (A) in orthothopic Py8119 breast tumors (32 days post-engraftment, 1199 ± 114mm3 tumor volume). (C) Frequency of JAM-A+ cells within the most abundant immune cell populations in the blood of MMTV-PyMT mice at early stage (no palpable tumor) and late stage (tumor volume reached 1500 mm3) of tumor progression. Dots connected with line denote values from the same animal. (D) Representative flow cytometry dot plots of JAM-A expression in Ly6Chi monocytes from the blood. (E) Changes in the frequency of JAM-A+ cells within Ly6Chi monocytes during tumor progression in the blood of mice with orthotopic Py8119 tumors or sc. LLC tumors (corresponding tumor volumes are shown in Supplementary Figure 2 ). (F) Frequency of JAM-A+ cells within Ly6Chi monocytes in the spleen and bone marrow (BM) of mice with orthotopic Py8119 tumors or sc. LLC tumors (time post-engraftment and tumor volume as in panels A and B). (G) JAM-A expression on GFP+ Ly6Chi bone marrow-derived monocytes adoptively transferred into LLC tumor-bearing mice on day 18 of tumor development. (H) Fold change of JAM-A+ cells within Ly6Chi monocytes in the blood of Il1b +/+ or Il1b -/- mice with sc. LLC tumors (day 19 post-engraftment) or orthotopic Py8119 tumors (day 35 post-engraftment) compared to naive Il1b +/+ mice (tumor burden is shown in Supplementary Figure 3 ). Cell type frequencies were determined using flow cytometry. Graphs show mean and SEM. Panel (C) paired two-tailed t-test; All other panels: unpaired two-tailed t-test; *P < 0.05, **P < 0.01, ***P < 0.001.

