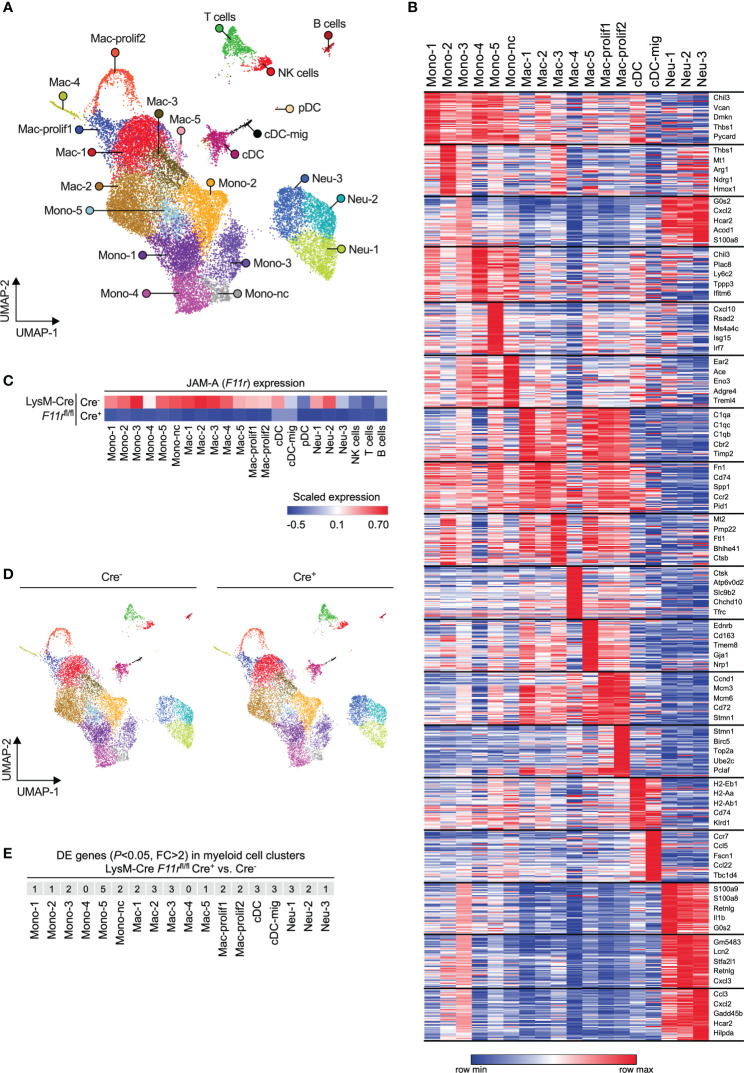
Figure 4.
JAM-A does not affect myeloid cell diversification in the tumor microenvironment. (A) UMAP plot showing CD45+ immune cells from LLC tumors of both F11r flox/flox LysM-Cre- and F11r flox/flox LysM-Cre+ mice color-coded by clusters defined based on single-cell RNA-seq data. (B) Heatmap showing the top 50 enriched genes in each myeloid cell cluster. The top 5 enriched genes per cluster are highlighted. See Supplementary Table 1 for list of top 50 enriched genes for all clusters shown in panel (A). (C) Heatmap showing F11r (encoding JAM-A) expression in tumors of F11r flox/flox LysM-Cre- and F11r flox/flox LysM-Cre+ mice based on single-cell RNA-seq data. (D) UMAP plots showing CD45+ immune cells from LLC tumors of F11r flox/flox LysM-Cre- or F11r flox/flox LysM-Cre+ mice color-coded by clusters shown in panel (A). (E) Number of differentially expressed (DE) genes (adjusted P value < 0.05, fold change (FC) > 2) between F11r flox/flox LysM-Cre+ and F11r flox/flox LysM-Cre- mice within each myeloid cell cluster. See Supplementary Table 2 for full list of DE genes.

