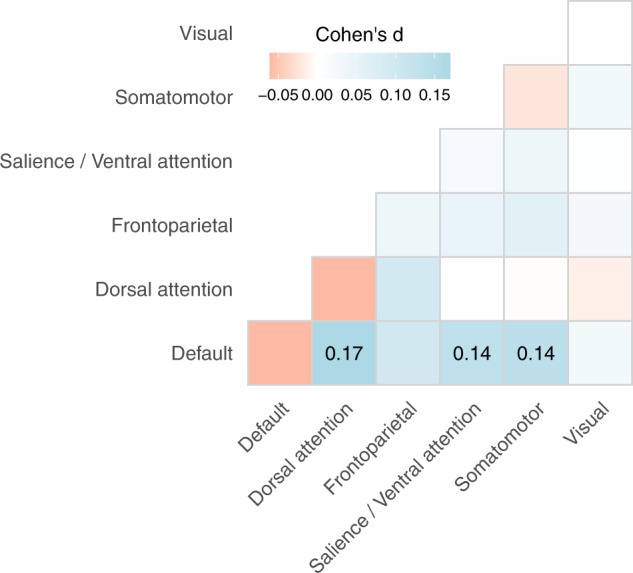
Fig. 2. Associations between ADHD diagnosis and connectivity within and between brain networks.

Red indicates a negative association. Blue indicates a positive association. Darker shades represent stronger associations. Effect sizes from the linear mixed models are presented for network connections significant at p < 0.05 after correction for multiple comparisons.
