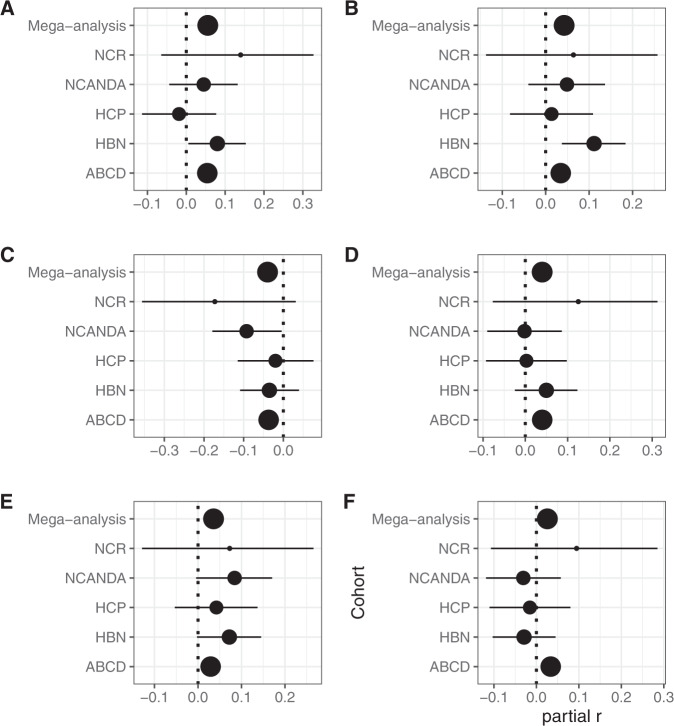
Fig. 3. Forest plots for significant associations (corrected p < 0.05) between ADHD-traits and resting-state connectivity (N = 10,113).
The top line shows the effect size (partial r) and corresponding 95% confidence intervals for the main mega-analytic model. The subsequent rows show the results of models performed within each cohort (NCR N = 100; NCANDA N = 504; HCP-D N = 494; HBN N = 692; ABCD N = 8323). Panel (A) shows the results for connectivity between the default mode network and the dorsal attention network. Panel (B) Shows the results for connectivity between the default mode network and the frontoparietal network. Panel (C) Shows the results for connectivity within the dorsal attention network. Panel (D) Shows the results for connectivity between the default mode network and the salience/ventral attention network. Panel (E) Shows the results for connectivity between the salience/ventral attention network and the somatomotor network. Panel (F) Shows the results for connectivity between the default mode network and the somatomotor network.

