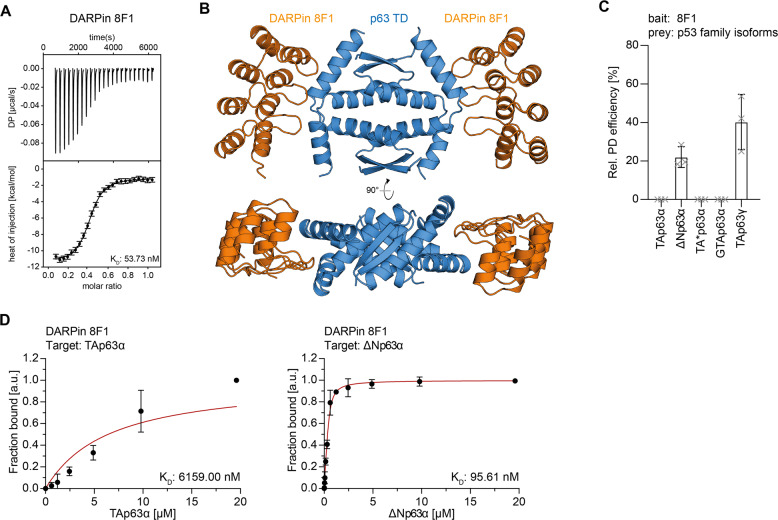
Fig. 2. Characterization of the TD-specific DARPin.
A ITC measurements of the DARPin 8F1 interacting with the TD of p63. The top diagram displays the raw measurement and the bottom diagram shows the integrated heat per titration step. The KD value is given for the interaction. B Crystal structure of the DARPin 8F1 in complex with the p63 TD showing a 2:1 stoichiometry in two different orientations that are rotated by 90°. C Pulldown experiments with different in-vitro translated p63 isoforms and immobilized DARPin 8F1. The results show that only open and tetrameric isoforms that exhibit a complete TD bind to the DARPin. The pulldown efficiency relative to the whole protein expression is displayed on the y-axis (n = 3). D Fluorescence anisotropy measurements of Alexa 488 labeled DARPin 8F1 with purified full-length TAp63α and ΔNp63α isoforms. Only the tetrameric ΔNp63α isoform binds strongly while only a negligible interaction is detected for dimeric TAp63α.

