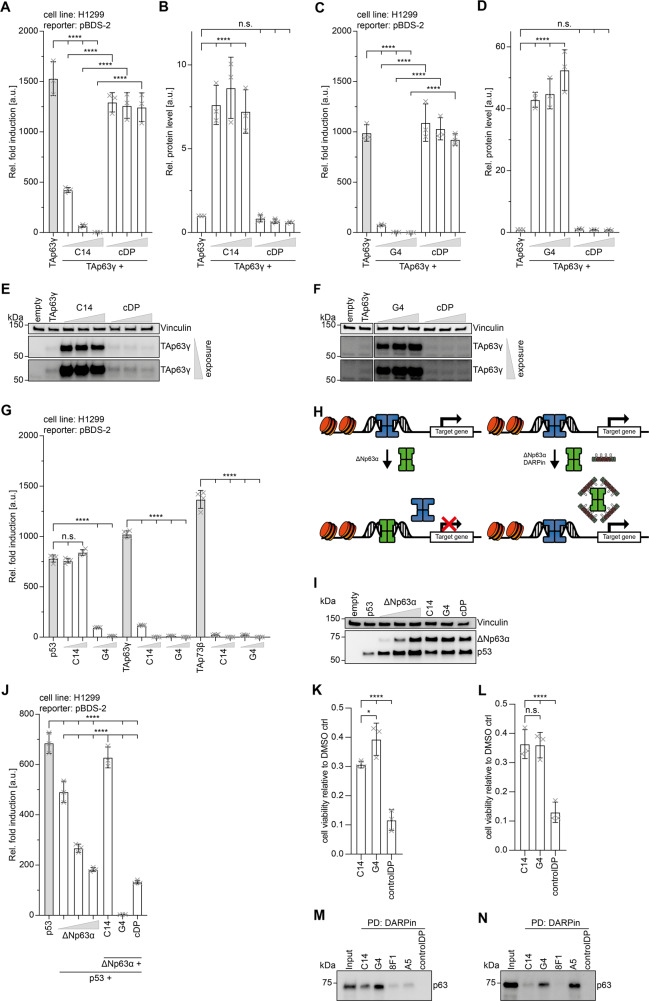
Fig. 6. DARPins C14 and G4 as inhibitors and pulldown experiments of p63 from primary tissue.
A Transactivation assays in H1299 cells with a luciferase expression construct under the control of a pBDS-2 promoter show strong transcriptional activity of TAp63γ. Co-expression of DARPin C14 inhibits transcriptional activity in a concentration-dependent manner. Co-expression of a control DARPin shows no effect. B Quantitative analysis of the protein level of TAp63γ of the experiment shown in (A). The corresponding western blots are displayed in (E). C The same experiments as in (A) with the DARPin G4. D Quantitative analysis of the protein level of TAp63γ of the experiment shown in (C). The corresponding western blots are displayed in (F). For all experiments in A-D, the bar diagrams show the mean values and error bars the corresponding SD of three biological replicates. Statistical significance was assessed by ordinary one-way ANOVA. E, F show the western blot results of the experiments in (A) and (C) detecting the level of myc-tagged TAp63γ with the anti-myc antibody 4A6 (Millipore). The level of vinculin serves as a loading control. Results with two different exposure times are shown. Co-expression of inhibitory DARPins result in a strong increase of the cellular level of TAp63γ, presumably by inhibiting its degradation. A control DARPin has no effect. The quantitative analysis is provided in (B) and (D). G Transactivation assay with p53, TAp63γ and TAp73β in H1299 cells. All three family members show high transcriptional activity. The transcriptional activity of p53 is inhibited by co-expression of DARPin G4, while DARPin C14 has no effect. The transcriptional activity of p63 and p73 is inhibited by both DARPins. The bar diagram shows the mean values and error bars show the corresponding SD of four technical replicates. Statistical significance was assessed by ordinary one-way ANOVA. H Schematic representation of the inhibitory effect of ΔNp63α on the transcriptional activity of p53. High concentrations of ΔNp63α (green) as they occur in squamous cell carcinoma displace p53 (blue) from the promoter sequences (left). Selective binding of DARPins to the DBD of p63 enables binding of p53 to these promoter sequences and thus transcription of the affected genes (right). I The transcriptional activity of p53 can be inhibited by ΔNp63α in a concentration-dependent manner as suggested in (H). Western blot analysis of the cellular levels of ΔNp63α and p53 of the data quantitatively analyzed in (J). Vinculin is used as a loading control. J Quantitative analysis of the reduction of the transcriptional activity of p53 with increasing concentration of ΔNp63α. The last three lanes show results of co-expressing ΔNp63α at its highest concentration. Expressing DARPin C14 in addition re-established the transcriptional activity of p53 while expression of DARPin G4 which binds to both the p53 and p63 DBD inhibits transcriptional activity completely. Co-expression of a control DARPin does not re-establish p53-based activity beyond the level seen without any DARPin but in the presence of the highest ΔNp63α concentration used. The bar diagram shows the mean values and error bars show the corresponding SD of three biological replicates. Statistical significance was assessed by ordinary one-way ANOVA. K Endpoint analysis of viable cells 89 h after 0.5 µM DOX treatment. The number of viable cells expressing control DARPin and TAp63α with a T2A self-cleaving peptide as a linker is significantly reduced compared to cells expressing DARPin C14 or G4. The bar diagram shows the mean values and error bars show the corresponding SD of three biological replicates. Statistical significance was assessed by ordinary one-way ANOVA. L Endpoint analysis of viable cells 89 h after 0.7 µM DOX treatment. The number of viable cells expressing control DARPin and TAp63α with a T2A self-cleaving peptide as a linker is significantly reduced compared to cells expressing C14 or G4. The bar diagram shows the mean values and error bars show the corresponding SD of three biological replicates. Statistical significance was assessed by ordinary one-way ANOVA. M Pulldown experiment of ΔNp63α from mouse skin extract. DBD-specific DARPins C14 and G4, TD-specific DARPin 8F1 and the SAM-domain-specific DARPin A5 were bound to streptavidin magnetic beads and incubated with the extract. The levels of ΔNp63α pulled down by the DARPins were measured by western blot analysis using an anti-p63 antibody (ab124762 - Abcam). All four DARPins show signals, with DARPin G4 binding strongest. The experiment was done in biological triplicates. One representative replicate is shown. N Same experiment as in (M) with extract produced from mouse ovaries. The pulldown experiments show that the oocyte-specific isoform TAp63α gets efficiently pulled down by DARPins G4 and in particular DARPin A5 but not DARPin 8F1, proving DARPin 8F1 as a conformation-specific binder of tetrameric p63 isoforms. The experiment was done in biological triplicates. One representative replicate is shown.

