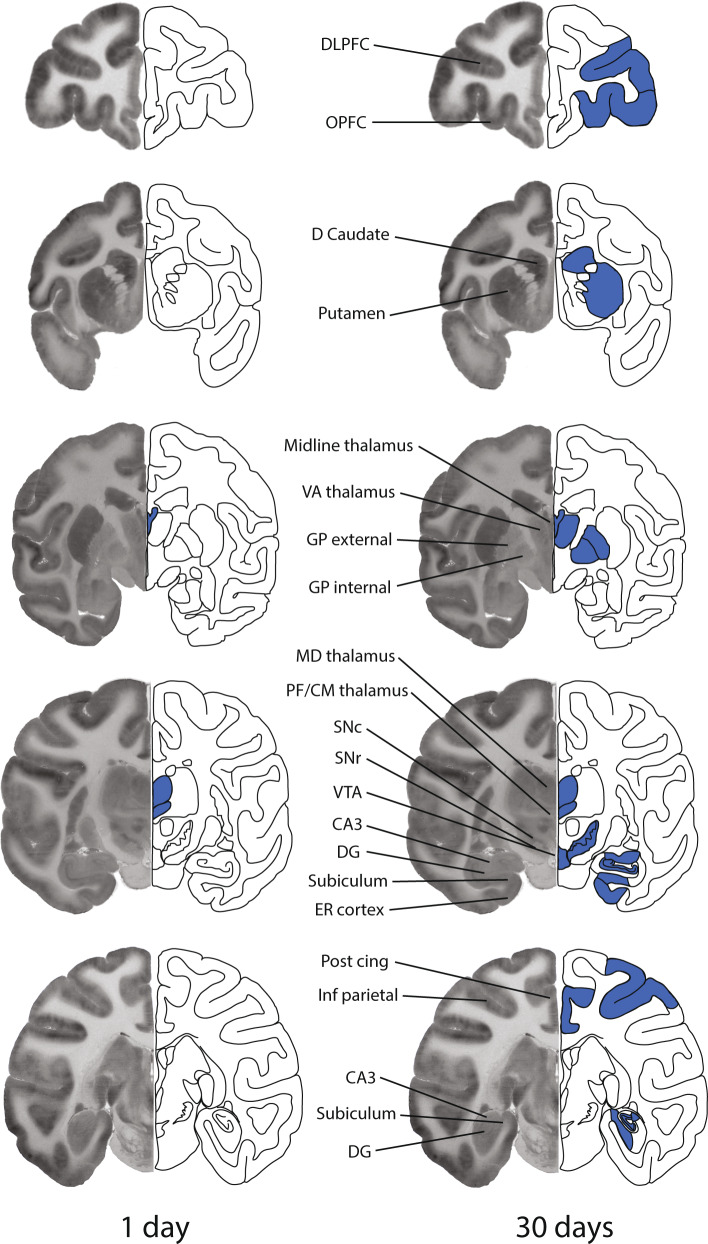
Fig. 2. Areas of significant alterations in local cerebral glucose utilization in the rhesus monkey brain 1 day (left panel) or 30 days (right panel) following the final session of 100 days of cocaine self-administration when accessed in a neutral environment.
Each brain image is a composite of a representative autoradiogram of 2-[14C]deoxyglucose uptake (left side) and a schematic (right side) of a coronal section of the monkey brain at one of five rostral to caudal levels corresponding to approximately +12.15, −00.45, −07.65, −13.05, and −18.00 from Bregma. Blue coloring superimposed on the schematics represents the location of significant decreases in rates of glucose utilization. Effects were bilateral, however for illustrative purposes the effects are depicted on the schematic side only. CA3, CA3 field of the hippocampus; D Caudate, dorsal caudate; DG dentate gyrus; DLPFC, dorsolateral prefrontal cortex; ER cortex, entorhinal cortex; GP external, globus pallidus external segment; GP internal, globus pallidus internal segment; Inf parietal, inferior parietal cortex; MD thalamus, mediodorsal thalamic nucleus; Med parietal, medial parietal cortex; OPFC, orbital prefrontal cortex; PF/CM thalamus, parafascicular/centromedian thalamic nuclei; Post cing, posterior cingulate; SNc, substantia nigra pars compacta; SNr, substantia nigra pars reticulata; VA thalamus, ventral anterior thalamic nucleus; VTA, ventral tegmental area.

