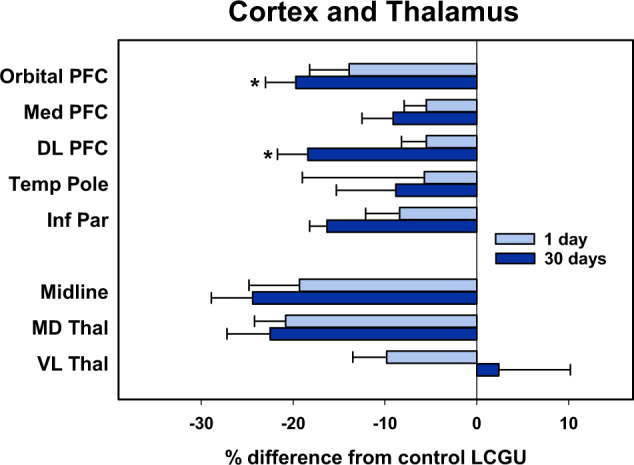
Fig. 4. Mean percent difference of rates of local cerebral glucose utilization (µmol/100 g/min) of selected brain regions in the neocortex and thalamus of monkeys 1 day (N = 4) or 30 days (N = 4) after cocaine self-administration from rates of food controls (N = 4) when assessed in a neutral environment.

Percentages were calculated by comparing individual rates in the 1 and 30 days groups to the mean of food controls. Data shown are the mean ± SEM. *p < 0.05, Student’s t test between 1 and 30 day abstinence groups. Orbital PFC, orbital prefrontal cortex; Med PFC, medial prefrontal cortex; DL PFC, dorsolateral prefrontal cortex; Temp Pole, temporal pole; Inf Par, inferior parietal cortex; Midline, midline thalamus; MD Thal, mediodorsal thalamus; VL Thal, ventrolateral thalamus.
