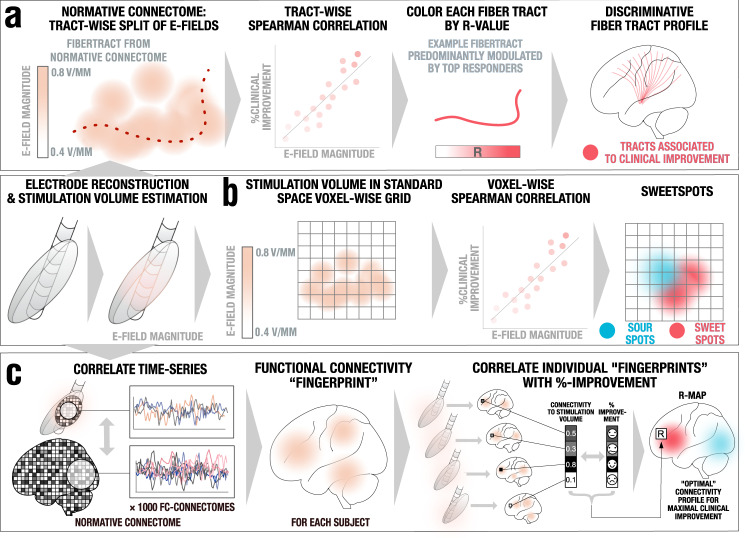
Fig. 1. Overview of the three methods applied.
A pre-requisite to run these analyses is to reconstruct the electrode trajectory and localization to then estimate the stimulation volume following the finite element method (FEM). a DBS fiber filtering. Stimulation volumes as E-fields were pooled in standard space and overlaid on an ultra-high resolution normative connectome43. Peak E-field magnitudes along each tract were aggregated for each stimulation volume and Spearman rank-correlated with clinical outcomes. This led to weights that were assigned to each fibertract. b DBS Sweetspot mapping. For each voxel, the E-field magnitudes and clinical outcomes were Spearman rank-correlated, leading to a map with positive and negative associations (sweet and sour spots). c DBS network mapping. Seeding BOLD-signal fluctuations from each E-field in a normative functional connectome consisting of rs-fMRI scans from 1000 healthy participants47 yielded a functional connectivity “fingerprint” map for each patient. Maps were then Spearman rank-correlated with clinical improvement in a voxel-wise manner to create an R-map model of optimal network connectivity.

