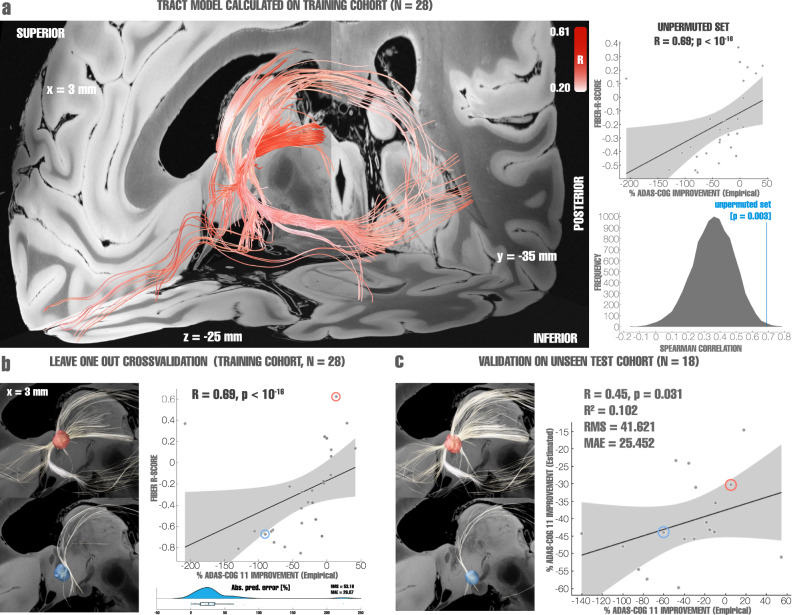
Fig. 2. Validation of tract models predictive of clinical improvements as evaluated using ADAS-cog 11.
a Left: Optimal set of tracts to be modulated as calculated from the entire training cohort (N = 28 subjects), red intensity codes for R-values ranging from 0.2 to 0.6, with darker colors indicating higher R-values. Right: permutation analysis calculated on the entire training cohort (R = 0.69 at p = 0.003). b Top left: stimulation volume of a patient with top clinical improvement overlapping the tracts associated with optimal clinical improvements (calculated leaving out the subject, N = 28-1 = 27 subjects). Fibers displayed in white correspond to the portion of optimal fibers intersecting with the patient’s stimulation volume. Bottom left: Same analysis carried out with a poor-responding example patient. Right: Cross-validation within the training cohort (N = 28) using a leave-one-out design (top, R = 0.69 at p < 10−16), Spearman correlation between the degree of stimulation of positive fibertracts (aggregated R-scores under each E-field) and clinical improvements, and within-fold analysis, reporting root mean square error (RMS) and median absolute error (MAE). The boxplot displays the interquartile range in the box with the median percentual absolute predicted error as a vertical line, whiskers extend to 1.5 times the interquartile range, outlier points outside of this range are plotted (bottom). The two example patients are marked in the correlation plot with circles. c Optimal tracts calculated from the entire training cohort (as shown in panel a, N = 28) were used to cross-predict outcomes in N = 18 patients of the hold-out cohort (R = 0.45, p = 0.031). Left: two example cases from the hold-out cohort are shown, a top responding patient’s stimulation volume with corresponding connected (white) optimal fibers defined by the training cohort; and a poor-responding patient’s stimulation volume with corresponding connected (white) fibers. The two example patients are marked in the correlation plot with circles. Right: Spearman correlation between the degree of stimulating positively correlated tracts from the training cohort by the hold-out cohort and clinical improvements of the latter, gray shaded areas represent 95% confidence intervals. Fiber tracts and example stimulation volumes were superimposed on slices of a 100-µm, 7T brain scan in MNI 152 space83.

