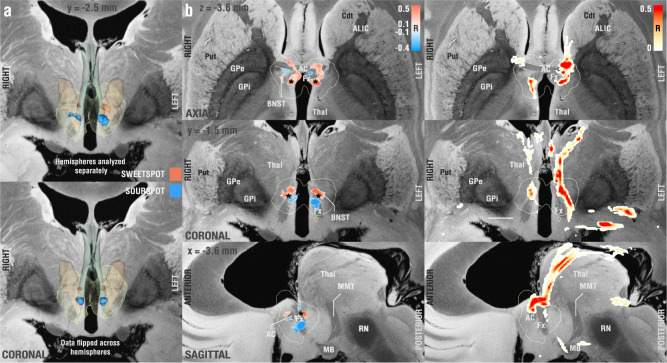
Fig. 3. Probabilistic mapping of sweet and sour spots associated with clinical outcome.
a Identified clusters of sweet (red) and sour (blue)-spots in a 3D view, superimposed on slices of a 100-µm, 7T brain scan in MNI 152 space83. Since the result was symmetric, on the bottom of the panel, we flipped stimulation volumes across hemispheres to further increase robustness on a voxel-level (effectively doubling the number of electrodes used in each hemisphere). b Axial, coronal, and sagittal views of sweet and sourspot peak coordinates (also see supplementary table 6). Projections of cluster center coordinates are marked by a black asterisk and directly project onto the intersection between fornix and bed nucleus of stria terminalis (BNST, see also supplementary Fig. 6). c Axial, coronal, and sagittal sections showing DBS fiber filtering results obtained from the whole cohort at MNI: X = −3.6, Y = −1.5, and Z = −3.6. Put Putamen, Cdt Caudate, ALIC Anterior limb of the internal capsule, AC Anterior commissure, GPe/i external/internal pallidum, Thal thalamus, RN red nucleus, MB mamillary bodies, Fx Fornix. Fornix is shown in blue-green color, informed by the CoBrALab Atlas46. Bed nucleus of the stria terminalis shown in light brown color, informed by Neudorfer et al.39.

