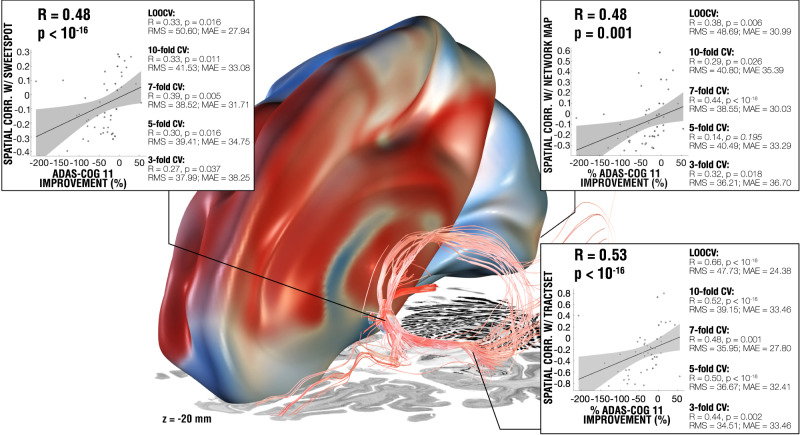
Fig. 5. Results summary including the models from DBS fiber filtering, sweetspot mapping and network mapping.
The three levels of analysis were able to explain a similar amount of variance of clinical outcomes when analyzed in a circular nature (see scatterplots; ∼16–19%) and led to significant cross-predictions of clinical outcomes across leave-one-patient-out and multiple k-fold designs, plots show fitting of a linear model that represents the degree to which stimulating voxels (left), functional regions (top-right) and tracts (bottom-right) explain variance in clinical outcomes across the whole cohort (N = 46) using Spearman correlation, gray shaded areas represent 95% confidence intervals. Three level analysis results were superimposed on slices of a brain cytoarchitecture atlas in MNI 152 space84. See supplementary Fig. 7 for additional metrics on each validation approach. RMS Root mean square error, MAE Median absolute error.

